PROTECTED SOURCE SCRIPT
已更新 Multi Timelines

Multi Timeline Indicator
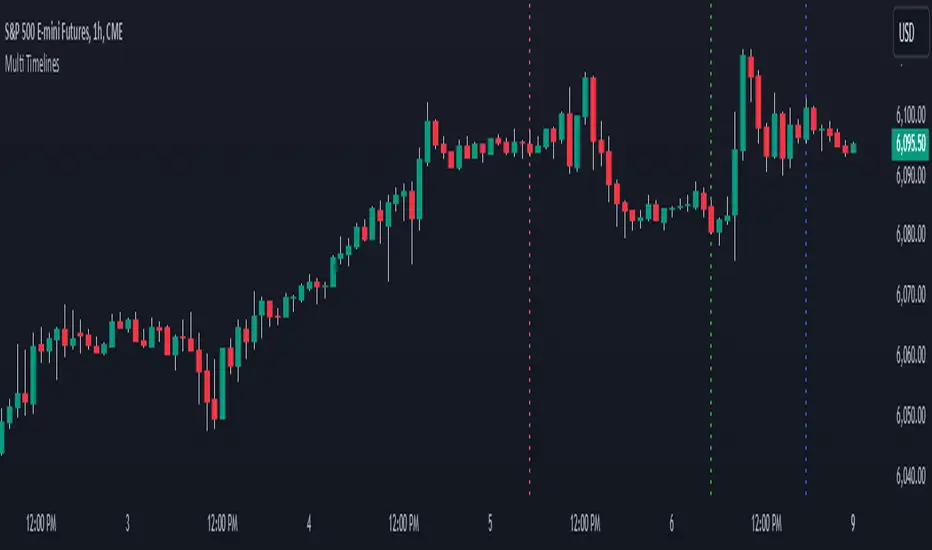
The Customizable Multi-Line Indicator is a versatile tool designed to help traders mark specific dates and times directly on their charts with visually distinct vertical lines. This indicator provides three fully customizable lines, each equipped with its own unique settings for visibility, color, style, and width. It is ideal for traders who want to highlight key events, track important price levels, or organize their charts around time-based triggers.
Features:
Three Customizable Lines:
Each line can be toggled on or off independently, allowing for a clutter-free chart.
Fully configurable settings for each line:
Date and Time: Specify the exact timestamp for the line placement.
Color: Choose any color to distinguish between the lines.
Line Width: Adjustable line thickness for better visibility.
Line Style: Options include solid, dashed, and dotted lines.
User-Friendly Inputs:
Intuitive input settings enable quick customization without needing to modify the script.
Simple checkboxes to control line visibility.
Clean and Efficient Design:
No labels or annotations clutter the chart.
The indicator ensures all lines are drawn precisely at the specified timestamps.
Lightweight and Optimized:
Designed to run efficiently without slowing down your chart, even with multiple lines.
Use Cases:
Mark Key Events: Highlight earnings dates, news events, or market open/close times.
Track Important Price Levels: Align lines with specific price action triggers for enhanced analysis.
Organize Trading Sessions: Define the start and end of trading sessions with visual markers.
Reminders for Strategy Execution: Use lines as visual reminders for executing trading strategies at predefined times.
How to Use:
Add the indicator to your chart.
Use the input panel to configure each line:
Toggle visibility with the checkbox.
Set the desired timestamp for each line.
Customize the color, style, and width.
Adjust your chart view to align with your analysis.
Compliance with TradingView Guidelines:
This indicator:
Does not include proprietary calculations or intellectual property from other indicators.
Avoids misleading titles or claims of guaranteed performance.
Does not use or reference any external data feeds or signals.
Focuses solely on providing charting tools for visual organization and analysis.
Disclaimer:
This tool is intended for informational purposes only and should not be considered financial advice. Always perform your due diligence and consult a financial advisor before making trading decisions.
版本注释
Updated to v6受保护脚本
此脚本以闭源形式发布。 但是,您可以自由使用,没有任何限制 — 了解更多信息这里。
NYTC
免责声明
这些信息和出版物并非旨在提供,也不构成TradingView提供或认可的任何形式的财务、投资、交易或其他类型的建议或推荐。请阅读使用条款了解更多信息。
受保护脚本
此脚本以闭源形式发布。 但是,您可以自由使用,没有任何限制 — 了解更多信息这里。
NYTC
免责声明
这些信息和出版物并非旨在提供,也不构成TradingView提供或认可的任何形式的财务、投资、交易或其他类型的建议或推荐。请阅读使用条款了解更多信息。