OPEN-SOURCE SCRIPT
% Stocks Above MA
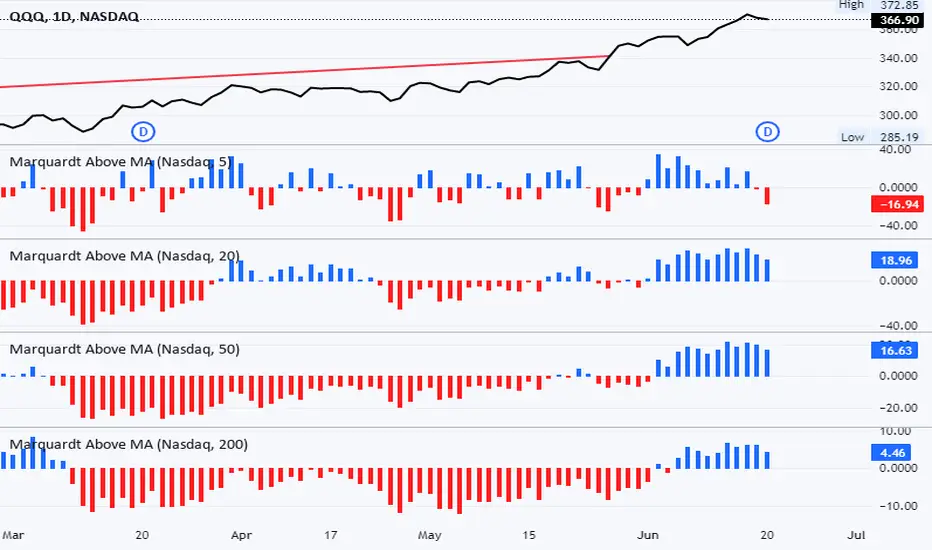
Breadth indicator showing % stocks above various moving averages. Histogram is positive (blue) when % stocks above selected MA is greater than 50%. Histogram is negative (red) when % of stocks above selected MA is less than 50%. Data manipulation causes the actual % value in y-axis to be incorrect but enhances visualization. Actual %'s are simply the displayed values + 50.
Improvements / suggestions welcome.
Improvements / suggestions welcome.
开源脚本
秉承TradingView的精神,该脚本的作者将其开源,以便交易者可以查看和验证其功能。向作者致敬!您可以免费使用该脚本,但请记住,重新发布代码须遵守我们的网站规则。
免责声明
这些信息和出版物并非旨在提供,也不构成TradingView提供或认可的任何形式的财务、投资、交易或其他类型的建议或推荐。请阅读使用条款了解更多信息。
开源脚本
秉承TradingView的精神,该脚本的作者将其开源,以便交易者可以查看和验证其功能。向作者致敬!您可以免费使用该脚本,但请记住,重新发布代码须遵守我们的网站规则。
免责声明
这些信息和出版物并非旨在提供,也不构成TradingView提供或认可的任何形式的财务、投资、交易或其他类型的建议或推荐。请阅读使用条款了解更多信息。