OPEN-SOURCE SCRIPT
Capiba Directional Momentum Oscillator (ADX-based)
🇬🇧 English
Summary
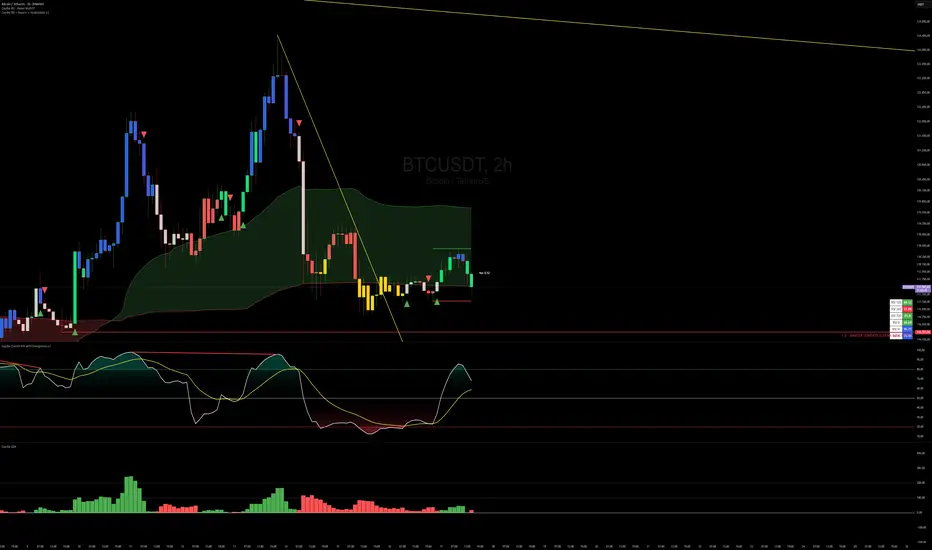
The Capiba ADX is a momentum oscillator that transforms the classic ADX (Average Directional Index) into a much more intuitive visual tool. Instead of analyzing three separate lines (ADX, DI+, DI-), this indicator consolidates the strength and direction of the trend into a single histogram that oscillates around the zero line.
The result is a clear and immediate reading of market sentiment, allowing traders to quickly identify who is in control—buyers or sellers—and with what intensity.
How to Interpret and Use the Indicator
The operation of the Capiba ADX is straightforward:
Green Histogram (Above Zero): Indicates that buying pressure (DI+) is in control. The height of the bar represents the magnitude of the bullish momentum. Taller green bars suggest a stronger uptrend.
Red Histogram (Below Zero): Indicates that selling pressure (DI-) is in control. The "depth" of the bar represents the magnitude of the bearish momentum. Lower (more negative) red bars suggest a stronger downtrend.
Zero Line (White): This is the equilibrium point. Crossovers through the zero line signal a potential shift in trend control.
Crossover Above: Buyers are taking control.
Crossover Below: Sellers are taking control.
Reference Levels (Momentum Strength)
The indicator plots three fixed reference levels to help gauge the intensity of the move:
0 Line: Equilibrium.
100 Line: Signals significant directional momentum. When the histogram surpasses this level, the trend (whether bullish or bearish) is gaining considerable strength.
200 Line: Signals very strong directional momentum, or even potential exhaustion conditions. Moves that reach this level are powerful but may also precede a consolidation or reversal.
Usage Strategy
Trend Confirmation: Use the indicator to confirm the direction of your analysis. If you are looking for long positions, the Capiba ADX should ideally be green and, preferably, rising.
Strength Identification: Watch for the histogram to cross the 100 and 200 levels to validate the strength of a breakout or an established trend.
Entry/Exit Signals: A zero-line crossover can be used as a primary entry or exit signal, especially when confirmed by other technical analysis tools.
Acknowledgements
This indicator is the result of adapting knowledge and open-source codes shared by the vibrant TradingView community.
开源脚本
秉承TradingView的精神,该脚本的作者将其开源,以便交易者可以查看和验证其功能。向作者致敬!您可以免费使用该脚本,但请记住,重新发布代码须遵守我们的网站规则。
免责声明
这些信息和出版物并非旨在提供,也不构成TradingView提供或认可的任何形式的财务、投资、交易或其他类型的建议或推荐。请阅读使用条款了解更多信息。
开源脚本
秉承TradingView的精神,该脚本的作者将其开源,以便交易者可以查看和验证其功能。向作者致敬!您可以免费使用该脚本,但请记住,重新发布代码须遵守我们的网站规则。
免责声明
这些信息和出版物并非旨在提供,也不构成TradingView提供或认可的任何形式的财务、投资、交易或其他类型的建议或推荐。请阅读使用条款了解更多信息。