OPEN-SOURCE SCRIPT
Relative Strength Heat [InvestorUnknown]
The Relative Strength Heat (RSH) indicator is a relative strength of an asset across multiple RSI periods through a dynamic heatmap and provides smoothed signals for overbought and oversold conditions. The indicator is highly customizable, allowing traders to adjust RSI periods, smoothing methods, and visual settings to suit their trading strategies.
The RSH indicator is particularly useful for identifying momentum shifts and potential reversal points by aggregating RSI data across a range of periods. It presents this data in a visually intuitive heatmap, with color-coded bands indicating overbought (red), oversold (green), or neutral (gray) conditions. Additionally, it includes signal lines for overbought and oversold indices, which can be smoothed using RAW, SMA, or EMA methods, and a table displaying the current index values.

Features
How It Works
The RSH indicator aggregates RSI calculations across 31 periods, starting from the user-defined Starting Period and incrementing by the Period Increment. For each period, it computes the RSI and determines whether the asset is overbought (RSI > threshold_ob) or oversold (RSI < threshold_os). These states are stored in arrays (ob_array for overbought, os_array for oversold) and used to generate the following outputs:
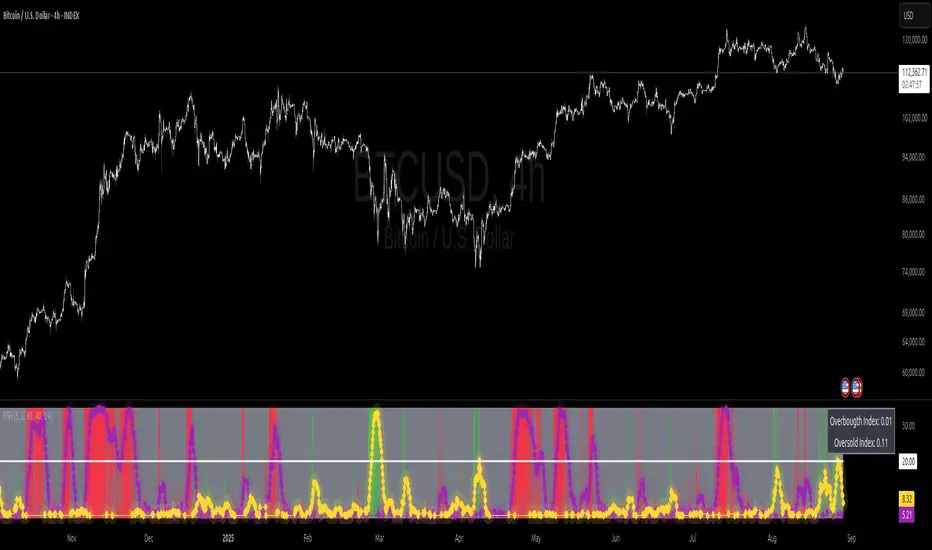
Heatmap: The indicator plots 31 horizontal bands, each representing an RSI period. The color of each band is determined by the f_col function:
Red if the RSI for that period is overbought (>threshold_ob).
Green if the RSI is oversold (<threshold_os).
Gray if neither condition is met. The bands are created using plot and fill functions to form a stacked heatmap.
Signal Indices:
The average of the overbought (avg_ob) and oversold (avg_os) arrays is calculated.
These averages are optionally smoothed using the user-selected method (RAW, SMA, or EMA).
The smoothed indices are scaled to match the RSI period range for plotting as signal lines (scaled_ob_index and scaled_os_index).
Plots:
Overbought Signal Line: Plotted in purple with a stepline-diamond style.
Oversold Signal Line: Plotted in yellow with a stepline-diamond style.
Midline: A white line at the midpoint of the RSI period range for reference.
Table: Displays the current overbought and oversold index values (rounded to two decimal places) in a table at the top-right of the chart.
Disclaimer
This indicator is intended for informational and educational purposes only. It does not constitute investment advice. Historical performance does not guarantee future results. Always backtest and use in simulation before live trading.
The RSH indicator is particularly useful for identifying momentum shifts and potential reversal points by aggregating RSI data across a range of periods. It presents this data in a visually intuitive heatmap, with color-coded bands indicating overbought (red), oversold (green), or neutral (gray) conditions. Additionally, it includes signal lines for overbought and oversold indices, which can be smoothed using RAW, SMA, or EMA methods, and a table displaying the current index values.
Features
- Dynamic RSI Periods: Calculates RSI across 31 periods, starting from a user-defined base period and incrementing by a specified step.
- Heatmap Visualization: Displays RSI strength as a color-coded heatmap, with red for overbought, green for oversold, and gray for neutral zones.
- Customizable Smoothing: Offers RAW, SMA, or EMA smoothing for overbought and oversold signals.
- Signal Lines: Plots scaled overbought (purple) and oversold (yellow) signal lines with a midline for reference.
- Information Table: Displays real-time overbought and oversold index values in a table at the top-right of the chart.
- User-Friendly Inputs: Allows customization of RSI source, period ranges, smoothing length, and colors.
How It Works
The RSH indicator aggregates RSI calculations across 31 periods, starting from the user-defined Starting Period and incrementing by the Period Increment. For each period, it computes the RSI and determines whether the asset is overbought (RSI > threshold_ob) or oversold (RSI < threshold_os). These states are stored in arrays (ob_array for overbought, os_array for oversold) and used to generate the following outputs:
Heatmap: The indicator plots 31 horizontal bands, each representing an RSI period. The color of each band is determined by the f_col function:
Red if the RSI for that period is overbought (>threshold_ob).
Green if the RSI is oversold (<threshold_os).
Gray if neither condition is met. The bands are created using plot and fill functions to form a stacked heatmap.
Signal Indices:
The average of the overbought (avg_ob) and oversold (avg_os) arrays is calculated.
These averages are optionally smoothed using the user-selected method (RAW, SMA, or EMA).
The smoothed indices are scaled to match the RSI period range for plotting as signal lines (scaled_ob_index and scaled_os_index).
Plots:
Overbought Signal Line: Plotted in purple with a stepline-diamond style.
Oversold Signal Line: Plotted in yellow with a stepline-diamond style.
Midline: A white line at the midpoint of the RSI period range for reference.
Table: Displays the current overbought and oversold index values (rounded to two decimal places) in a table at the top-right of the chart.
Disclaimer
This indicator is intended for informational and educational purposes only. It does not constitute investment advice. Historical performance does not guarantee future results. Always backtest and use in simulation before live trading.
开源脚本
秉承TradingView的精神,该脚本的作者将其开源,以便交易者可以查看和验证其功能。向作者致敬!您可以免费使用该脚本,但请记住,重新发布代码须遵守我们的网站规则。
免责声明
这些信息和出版物并非旨在提供,也不构成TradingView提供或认可的任何形式的财务、投资、交易或其他类型的建议或推荐。请阅读使用条款了解更多信息。
开源脚本
秉承TradingView的精神,该脚本的作者将其开源,以便交易者可以查看和验证其功能。向作者致敬!您可以免费使用该脚本,但请记住,重新发布代码须遵守我们的网站规则。
免责声明
这些信息和出版物并非旨在提供,也不构成TradingView提供或认可的任何形式的财务、投资、交易或其他类型的建议或推荐。请阅读使用条款了解更多信息。