INVITE-ONLY SCRIPT
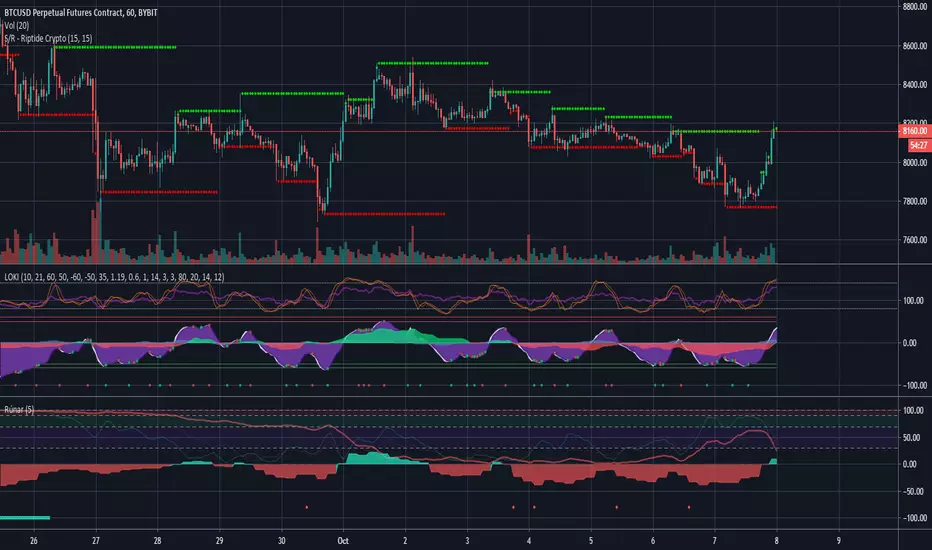
Support/Resistance - Riptide Crypto

The indicator aims to give a clearer view of linear support resistance zones, unlike the volatility bands. The support resistance zones aims to find these levels on lower timeframes and avoid printing them on wicks which are rarely the real zone. This gives us a clearer indication of clean breaks through S/R zones.
If you'd like to learn more about the indicators or just want to discuss some TA come.
If you'd like to learn more about the indicators or just want to discuss some TA come.
免责声明
这些信息和出版物并非旨在提供,也不构成TradingView提供或认可的任何形式的财务、投资、交易或其他类型的建议或推荐。请阅读使用条款了解更多信息。