PROTECTED SOURCE SCRIPT
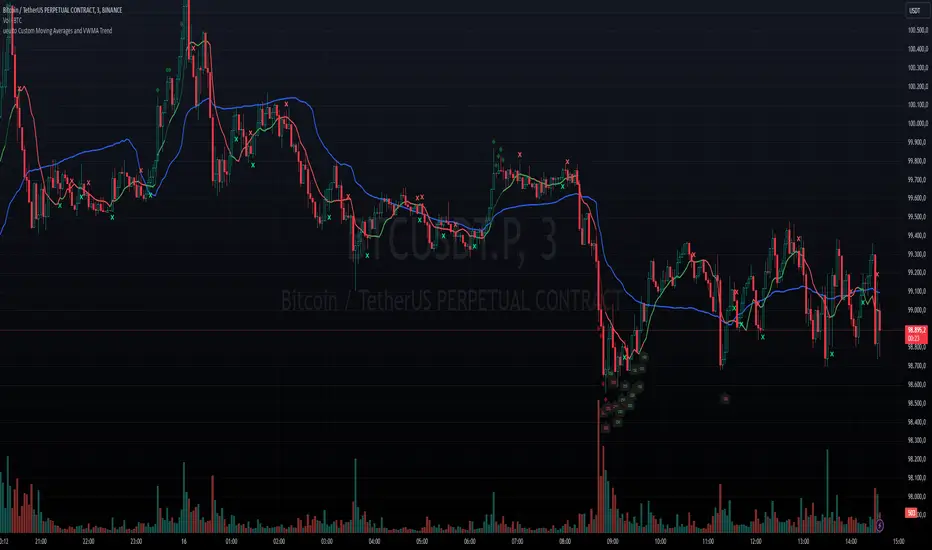
ueuito Custom Moving Averages and VWMA Trend
Description in English:
is a customizable indicator that combines multiple technical analysis tools to identify market trends and buy/sell signals. It integrates moving averages (including VWMA), RSI, MACD, and various configurable levels, providing detailed visual analysis on the chart.
Key Features:
Customizable Moving Averages:
Supports SMA, EMA, WMA, VWMA, and RMA.
Allows for customizing the period and displaying up to two moving averages simultaneously.
VWMA with RSI Indication:
VWMA changes color based on RSI conditions:
Overbought color when RSI exceeds a configurable level.
Oversold color when RSI drops below a configurable level.
MACD and Crossovers:
Detects MACD crossovers with the signal line and highlights them on the chart.
Includes visual indicators to mark key moments of MACD rising or falling.
Overbought/Oversold Signals:
Adds visual markers when RSI exceeds user-defined levels (overbought or oversold).
MACD Level Indicators:
Displays specific values on the chart when MACD reaches predefined levels, with color adjustments based on trend direction.
Advanced Configurations:
Configurable parameters for vertical offset, label colors, and alert levels.
Provides flexibility to tailor the indicator’s appearance and behavior.
Still improving...
受保护脚本
此脚本以闭源形式发布。 但是,您可以自由使用,没有任何限制 — 了解更多信息这里。
免责声明
这些信息和出版物并非旨在提供,也不构成TradingView提供或认可的任何形式的财务、投资、交易或其他类型的建议或推荐。请阅读使用条款了解更多信息。
免责声明
这些信息和出版物并非旨在提供,也不构成TradingView提供或认可的任何形式的财务、投资、交易或其他类型的建议或推荐。请阅读使用条款了解更多信息。