OPEN-SOURCE SCRIPT
已更新 LiquidityPulse Multi-Timeframe Volume Zones/ Levels
LiquidityPulse Multi-Timeframe Volume Zones/ Levels
Non-repainting: levels appear on bar close and do not change.
What This Indicator Does
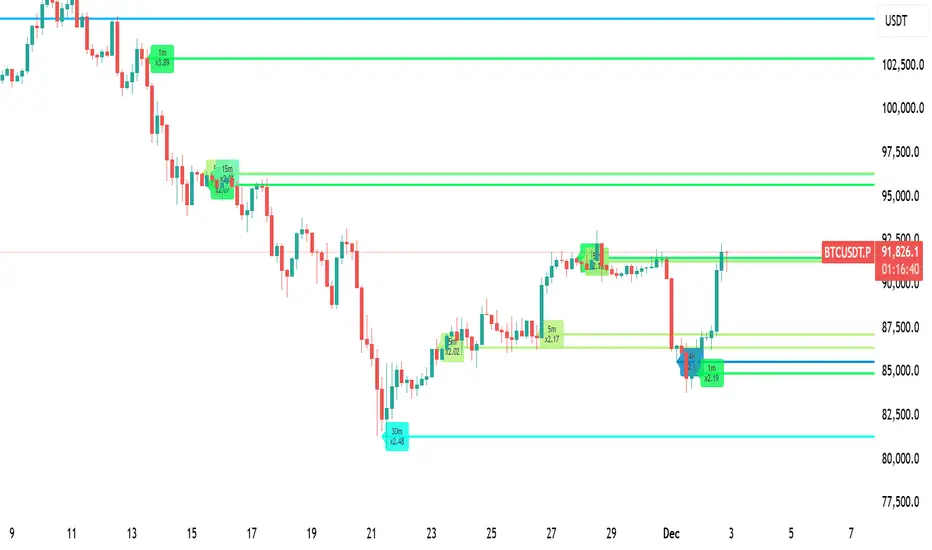
This indicator scans lower-timeframe price action to identify bars where volume and candle behaviour suggest that a notable price interaction occurred. When all conditions align, the script extracts a precise price level from that bar, plots it on your higher-timeframe chart, and extends it forward so you can observe whether the market interacts with it again later.
Each selected timeframe is processed independently. For every timeframe you enable, the script looks for the following criteria:
1. A shift in candle direction between the previous bar and the current bar
2. A close-to-open body alignment, helping filter out irregular or noisy movement
3. A volume increase relative to the recent average, based on a user-selected multiplier
If these conditions are met, the script marks the corresponding price level on the chart. You can enable up to seven lower timeframes at once, each with its own independent settings, colours, strength filters, and display capacity. This allows you to build a layered, multi-timeframe view of the levels/ zones.
How It Works
1. Candle Behaviour Shift
The script checks whether the previous bar and the current bar show opposing directional behaviour. This helps highlight moments that may reflect a shift in directional behaviour or a change in price movement characteristics.
2. Body Alignment
The previous bar’s close must closely align with the current bar’s open. This requirement reduces random noise and focuses detection on areas where structure between candles is unusually clean.
3. Volume Requirement
The combined volume of the current bar and the previous bar must exceed the recent average by a multiplier you choose.
This filters for bars with above-average participation (volume).
4. Price Level Identification
If all conditions are met, a price edge is defined:
This edge marks the price level where the qualifying candle behaviour occurred.
5. Zone Drawing
Each qualifying event produces:
The level then extends forward so you can monitor future interactions.
Key Settings
Zone Strength (Volume Multiplier)
Determines how selective the volume filter is.
Multi-Timeframe Framework
You can display a single timeframe or stack several to highlight clustering.
How traders can use this indicator
This script is not a buy/sell signal generator. It is best used as a structural overlay that helps you identify:
Why this type of detection can be informative
Higher-timeframe charts compress a large amount of lower-timeframe activity. By identifying where the script found notable changes in direction, structure, and relative volume on a lower timeframe, it provides a way to reference points in the price history where behaviour differed from nearby bars. Displaying these levels on a higher timeframe allows traders to see how these conditions align with their broader analysis.
Disclaimer
This indicator does not measure true liquidity or order flow. It uses candle structure and relative-volume comparisons as interpretive tools, and the plotted levels do not represent signals or predictions. All analysis is user-interpreted, and past behaviour does not imply future behaviour.
Non-repainting: levels appear on bar close and do not change.
What This Indicator Does
This indicator scans lower-timeframe price action to identify bars where volume and candle behaviour suggest that a notable price interaction occurred. When all conditions align, the script extracts a precise price level from that bar, plots it on your higher-timeframe chart, and extends it forward so you can observe whether the market interacts with it again later.
Each selected timeframe is processed independently. For every timeframe you enable, the script looks for the following criteria:
1. A shift in candle direction between the previous bar and the current bar
2. A close-to-open body alignment, helping filter out irregular or noisy movement
3. A volume increase relative to the recent average, based on a user-selected multiplier
If these conditions are met, the script marks the corresponding price level on the chart. You can enable up to seven lower timeframes at once, each with its own independent settings, colours, strength filters, and display capacity. This allows you to build a layered, multi-timeframe view of the levels/ zones.
How It Works
1. Candle Behaviour Shift
The script checks whether the previous bar and the current bar show opposing directional behaviour. This helps highlight moments that may reflect a shift in directional behaviour or a change in price movement characteristics.
2. Body Alignment
The previous bar’s close must closely align with the current bar’s open. This requirement reduces random noise and focuses detection on areas where structure between candles is unusually clean.
3. Volume Requirement
The combined volume of the current bar and the previous bar must exceed the recent average by a multiplier you choose.
- Lower multiplier - more levels
- Higher multiplier - only the most significant activity spikes qualify
This filters for bars with above-average participation (volume).
4. Price Level Identification
If all conditions are met, a price edge is defined:
- Bearish pressure: upper edge
- Bullish pressure: lower edge
This edge marks the price level where the qualifying candle behaviour occurred.
5. Zone Drawing
Each qualifying event produces:
- A horizontal line marking the level
- A (optional) shaded box around the level
- A label showing the timeframe and the exact volume multiplier amount detected
The level then extends forward so you can monitor future interactions.
Key Settings
Zone Strength (Volume Multiplier)
Determines how selective the volume filter is.
- Lower settings show more frequent activity
- Higher settings restrict detection to only the strongest activity (volume) increases
Multi-Timeframe Framework
- Enable/disable per timeframe
- Custom source timeframe (e.g., 1m, 5m, 15m, etc.)
- Strength threshold per timeframe
- How many recent levels to display per timeframe (Show Last N Zones.)
You can display a single timeframe or stack several to highlight clustering.
How traders can use this indicator
This script is not a buy/sell signal generator. It is best used as a structural overlay that helps you identify:
- Where candle behaviour abruptly shifted with increased volume
- Whether multiple timeframes highlight similar levels
- Comparing how frequently these conditions appear across different timeframes
- How price behaves when revisiting areas of prior activity (levels)
Why this type of detection can be informative
Higher-timeframe charts compress a large amount of lower-timeframe activity. By identifying where the script found notable changes in direction, structure, and relative volume on a lower timeframe, it provides a way to reference points in the price history where behaviour differed from nearby bars. Displaying these levels on a higher timeframe allows traders to see how these conditions align with their broader analysis.
Disclaimer
This indicator does not measure true liquidity or order flow. It uses candle structure and relative-volume comparisons as interpretive tools, and the plotted levels do not represent signals or predictions. All analysis is user-interpreted, and past behaviour does not imply future behaviour.
版本注释
Fixed repainting issue.版本注释
*Fixed alerts. Further improvements to multi timeframe function to come开源脚本
秉承TradingView的精神,该脚本的作者将其开源,以便交易者可以查看和验证其功能。向作者致敬!您可以免费使用该脚本,但请记住,重新发布代码须遵守我们的网站规则。
免责声明
这些信息和出版物并非旨在提供,也不构成TradingView提供或认可的任何形式的财务、投资、交易或其他类型的建议或推荐。请阅读使用条款了解更多信息。
开源脚本
秉承TradingView的精神,该脚本的作者将其开源,以便交易者可以查看和验证其功能。向作者致敬!您可以免费使用该脚本,但请记住,重新发布代码须遵守我们的网站规则。
免责声明
这些信息和出版物并非旨在提供,也不构成TradingView提供或认可的任何形式的财务、投资、交易或其他类型的建议或推荐。请阅读使用条款了解更多信息。