OPEN-SOURCE SCRIPT
已更新 Daily Historical Volatility StdDev Levels
Description:
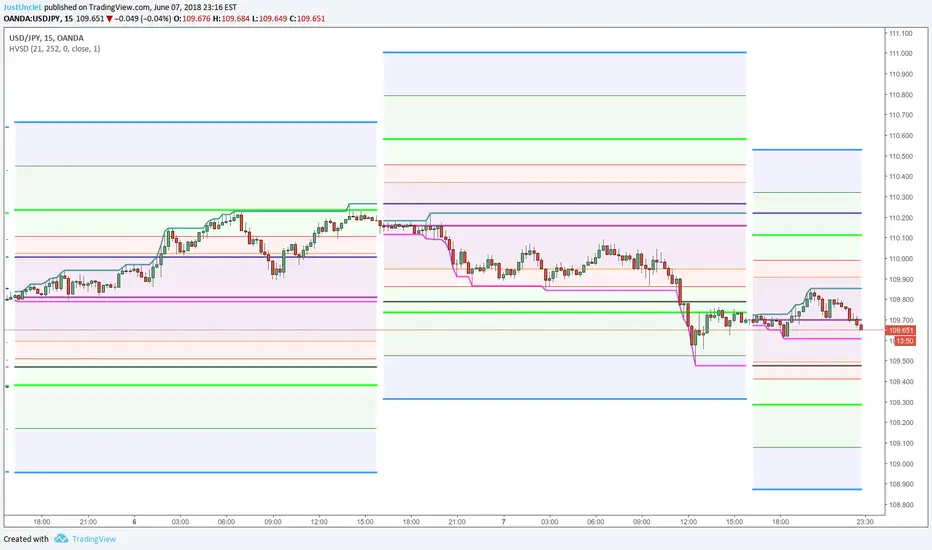
This indicator plots Daily Standard deviation levels on price chart based on Historical Volatility (HV). It uses the most common approach for calculating historical volatility as standard deviation of logarithmic returns, based on daily closing/settlement prices.
Assets: Currency Pairs, Commodities, also works on stocks, some indices.
Time Frames: 5min to 60min. This will also work on Daily Chart, by setting "DaystoExpire" to 21
Options:
References:
This indicator plots Daily Standard deviation levels on price chart based on Historical Volatility (HV). It uses the most common approach for calculating historical volatility as standard deviation of logarithmic returns, based on daily closing/settlement prices.
Assets: Currency Pairs, Commodities, also works on stocks, some indices.
Time Frames: 5min to 60min. This will also work on Daily Chart, by setting "DaystoExpire" to 21
Options:
- Use Daily Data to Calculate StdDev HV (default), otherwise use the charts Time Frame
- Lookback = number of days/periods to calculate stddev of HV (21 by default)
- Annual = number of trading days in a calender year (252 by default)
- Days to Expiry = number of days for the life of this option ( for auto calculation
this is 1 for intraday, 21 for daily and annual when chart TF used) - Settlement Source = close price by default, can use another source.
- Settlement Volume Weighted Average Length = by setting this to >1 then an average
is used for settlement. - Display ### Standard Deviation Levels = select what levels are to be displayed.
References:
- How To Use Standard Deviation In Your Trading Day: https://www.youtube.com/watch?v=i28w9HBmJdQ&feature=youtu.be
- Deviation Levels Indicator: [url= youtube.com/watch?v=EjHDNIKQH5k&feature=youtu.be]youtube.com/watch?v=EjHDNIKQH5k&feature=youtu.be
- http://www.macroption.com/historical-volatility-calculation/
- Historical Volatility based Standard Deviation_V2 by ucsgears
- Historical Volatility Strategy by Hpotter
版本注释
Corrected Change of day detection for Intraday TFsCorrected -0.75 Label.
版本注释
Small changes:- Changed to only display background fill for upto +/- 1 Stddev.
- Added option to Display Todays Only Levels.
版本注释
...- Made changes so that it also work with Renko Charts, BUT only works well with short TF (<=5min) and brick (<=6pip).
- Added Option to display Previous Day's High Low Levels.
- Added Option to display Current Day's High Low Levels.
- Changed 0.75 level to 0.7 level.
- Shortened short title to "HVSD" for easier visual when Indicator Labels are used.
版本注释
...- Modified the way displaying "Only Today" levels, now only show up within the current days price action.
版本注释
Efficiency Update- Improved efficiency by reducing the number of plot lines required by adding "style=2" (Line with Breaks) to the plot options.
- Added fill colour for 2nd and 3rd Stddevs.
版本注释
Minor update- Corrected no History flag "nohist" calculation, would misread the number of days of data left in the history.
开源脚本
秉承TradingView的精神,该脚本的作者将其开源,以便交易者可以查看和验证其功能。向作者致敬!您可以免费使用该脚本,但请记住,重新发布代码须遵守我们的网站规则。
JustUncleL
免责声明
这些信息和出版物并非旨在提供,也不构成TradingView提供或认可的任何形式的财务、投资、交易或其他类型的建议或推荐。请阅读使用条款了解更多信息。
开源脚本
秉承TradingView的精神,该脚本的作者将其开源,以便交易者可以查看和验证其功能。向作者致敬!您可以免费使用该脚本,但请记住,重新发布代码须遵守我们的网站规则。
JustUncleL
免责声明
这些信息和出版物并非旨在提供,也不构成TradingView提供或认可的任何形式的财务、投资、交易或其他类型的建议或推荐。请阅读使用条款了解更多信息。