PROTECTED SOURCE SCRIPT
9, 21, 50 EMA TN
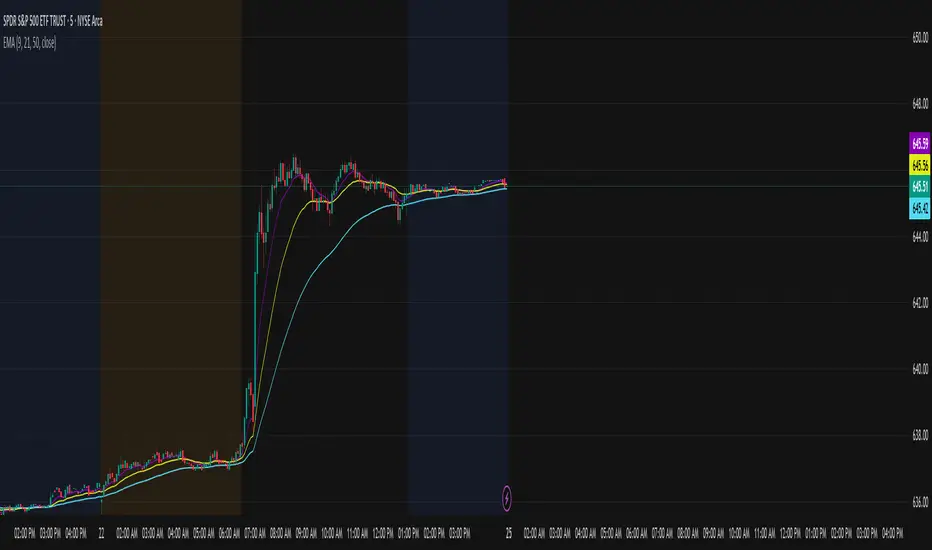
This indicator plots three exponential moving averages (EMAs) on the chart:
9 EMA (purple) – short-term trend and momentum
21 EMA (yellow) – medium-term trend
50 EMA (cyan) – long-term trend and overall market direction
How it’s used:
Traders look for the 9 EMA to cross above the 21 EMA as a potential bullish signal. This suggests upward momentum and may be used as confirmation for call entries.
Conversely, when the 9 EMA crosses below the 21 EMA, it can indicate bearish momentum, often used as confirmation for put entries.
The 50 EMA acts as a higher timeframe filter: when price and the shorter EMAs are above the 50 EMA, it confirms bullish bias; when they’re below, it confirms bearish bias.
This tool helps identify short-term momentum shifts while staying aligned with the larger market trend.
受保护脚本
此脚本以闭源形式发布。 但是,您可以自由使用,没有任何限制 — 了解更多信息这里。
免责声明
这些信息和出版物并非旨在提供,也不构成TradingView提供或认可的任何形式的财务、投资、交易或其他类型的建议或推荐。请阅读使用条款了解更多信息。
受保护脚本
此脚本以闭源形式发布。 但是,您可以自由使用,没有任何限制 — 了解更多信息这里。
免责声明
这些信息和出版物并非旨在提供,也不构成TradingView提供或认可的任何形式的财务、投资、交易或其他类型的建议或推荐。请阅读使用条款了解更多信息。