PROTECTED SOURCE SCRIPT
JXMJXRS - Wick Rejection Zones
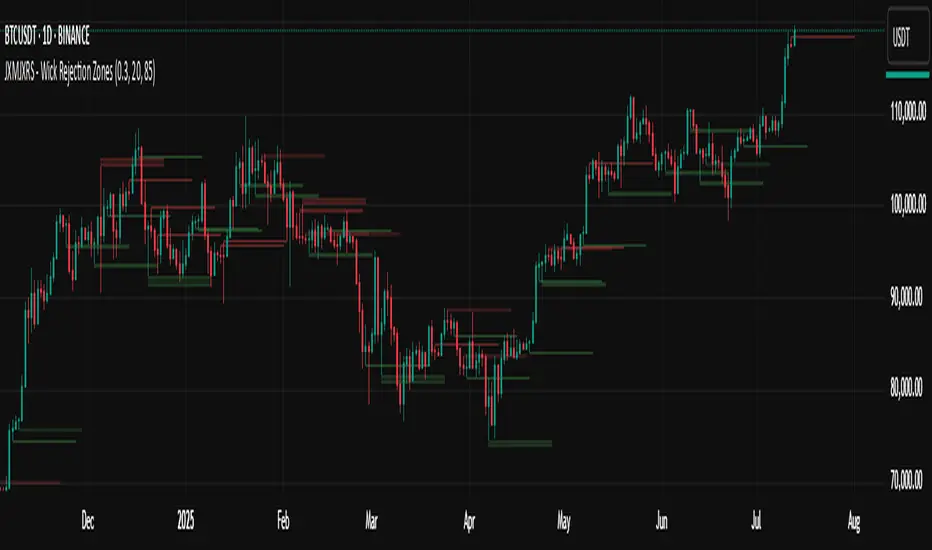
Wick Rejection Zones indicator is designed to identify key price levels where strong rejections occur, typically marked by long wicks and small candle bodies. These zones often signal areas of supply and demand where price was forcefully rejected, making them useful for anticipating potential support or resistance.
The script detects bullish rejection zones when a candle shows a long lower wick, a small body near the top of the candle, and a close above the open. Conversely, bearish rejection zones are identified by long upper wicks, small bodies near the candle low, and a close below the open. This stricter version only highlights the most decisive rejections by enforcing wick dominance and body positioning filters.
When these conditions are met, the indicator draws a colored zone above or below the candle wick to visually represent the rejection area. These zones persist on the chart for a fixed number of bars, allowing traders to reference them for potential reaction levels.
Settings:
Zone Duration (Bars) allows you to control how long each rejection zone remains visible on the chart. A higher number keeps zones active for more bars, while a lower number removes them sooner.
Zone Transparency adjusts the visual opacity of the rejection zones. A lower value makes the zone more visible, while a higher value makes it more transparent.
Bullish Zone Color and Bearish Zone Color let you customize the colors used for bullish and bearish rejection zones, respectively.
This tool is particularly effective in volatile crypto markets where wicks often mark sharp reversals or failed breakout attempts. It can be used as a reference for entries, exits, or stop-loss placement depending on market context.
受保护脚本
此脚本以闭源形式发布。 但是,您可以自由使用,没有任何限制 — 了解更多信息这里。
免责声明
这些信息和出版物并非旨在提供,也不构成TradingView提供或认可的任何形式的财务、投资、交易或其他类型的建议或推荐。请阅读使用条款了解更多信息。
免责声明
这些信息和出版物并非旨在提供,也不构成TradingView提供或认可的任何形式的财务、投资、交易或其他类型的建议或推荐。请阅读使用条款了解更多信息。