OPEN-SOURCE SCRIPT
已更新 [blackcat] L1 Chop Zones
Level: 1
Background
I was inspired by NILX's "Tool: Chop & Trade Zones". This can used as an element for trading system control.
Function
I use my own customized algorithm to replace that core of NILX one, which is targetting to provide smoother and trend for chop and trend judgement.
Since it is quite differnt now but an oscillator within range of 0~100. The pro is it can use the contstant threshold values for all time frames and all trading pairs now.
Remarks
Feedbacks are appreciated.
版本注释
make the plot line change color according to sentiment版本注释
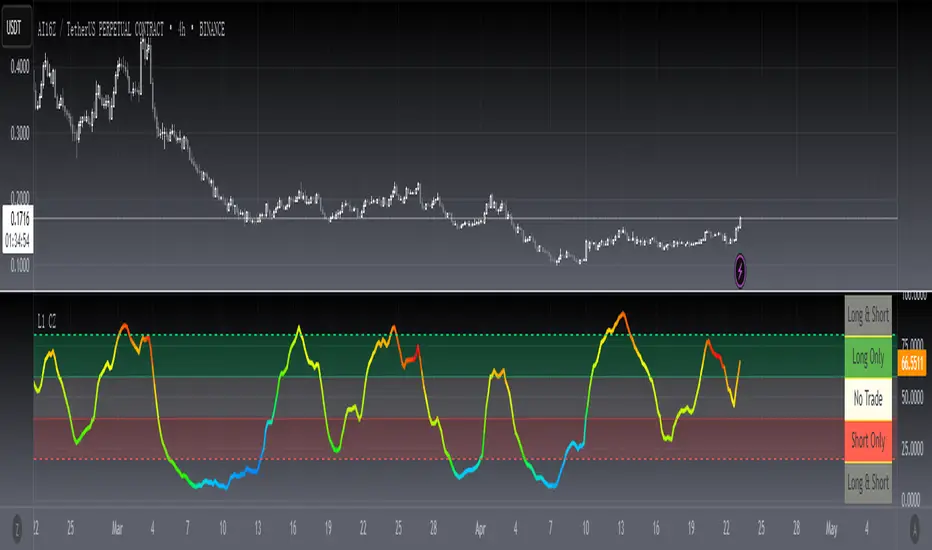
OVERVIEWThe [blackcat] L1 Chop Zones indicator helps traders identify market conditions by highlighting areas of consolidation or "chopping" around key price levels. This script uses a combination of weighted moving averages, risk assessment calculations, and customizable thresholds to create visual zones that indicate whether the market is suitable for long, short, or no trades 📉↗️.
FEATURES
Customizable input parameters:
Length: Number of bars considered in calculations.
Source Price: The price source used for analysis (default: close).
Thresholds: Percentage distance thresholds for identifying chop zones and trading opportunities.
Calculates trend strength using a proprietary risk assessment algorithm.
Plots distinct zones on the chart:
Chop Zone: Gray area indicating market consolidation.
Long Only: Green area suggesting favorable conditions for long positions.
Short Only: Red area indicating potential shorting opportunities.
No Trade: White area advising against taking any position.
Displays a dynamic gradient-colored line representing trend strength based on RSI values 🌈
HOW TO USE
Add the indicator to your TradingView chart by selecting it from the indicators list.
Adjust the input parameters (Length, Source Price, and Thresholds) according to your preferences ⚙️.
Observe the plotted zones on the chart to determine current market conditions.
Use the colored gradient line as an additional confirmation tool for trend direction.
Combine this indicator with other forms of analysis for more reliable trading decisions.
LIMITATIONS
The effectiveness of the indicator may vary depending on the asset and timeframe being analyzed.
Users should be cautious during periods of high volatility or sudden market shifts 🌪️.
False signals can occur; always confirm with other technical tools before making trading decisions.
NOTES
Ensure that you have sufficient historical data available for accurate calculations.
Test the indicator thoroughly on demo accounts before applying it to live trading 🔍.
Customize the appearance and parameters as needed to fit your trading strategy.
开源脚本
秉承TradingView的精神,该脚本的作者将其开源,以便交易者可以查看和验证其功能。向作者致敬!您可以免费使用该脚本,但请记住,重新发布代码须遵守我们的网站规则。
Avoid losing contact!Don't miss out! The first and most important thing to do is to join my Discord chat now! Click here to start your adventure: discord.com/invite/ZTGpQJq 防止失联,请立即行动,加入本猫聊天群: discord.com/invite/ZTGpQJq
免责声明
这些信息和出版物并非旨在提供,也不构成TradingView提供或认可的任何形式的财务、投资、交易或其他类型的建议或推荐。请阅读使用条款了解更多信息。