OPEN-SOURCE SCRIPT
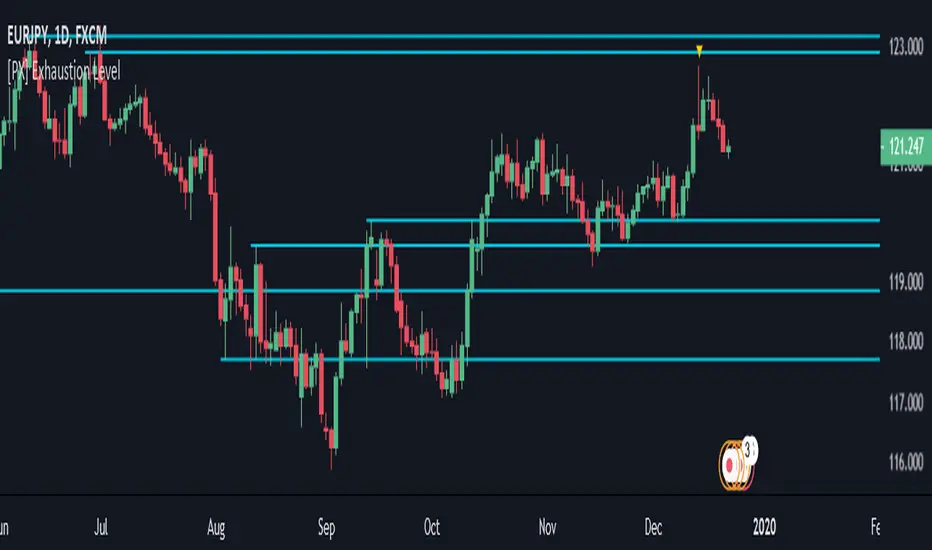
[PX] Exhaustion Level
Hello guys,
I love to play around with different methods for detecting support and resistance level. So today here is a new approach, which could be interesting to a few of you. I call it exhaustion level.
I'll give a brief introduction on how the indicator works and leave the testing/applying to you.
How does it work?
The method is basically very simple. The indicator constantly keeps track of the difference between the current close and the VWAP. The detected value will then be normalized and therefore put into comparison to it's previous "n" candles. (You decide yourself which value will be used for "n" by setting the "Length"-parameter in the settings tab.)
Once the normalized value equals "1", the price movement is considered to be somewhat overheated and the indicator starts plotting a level at the current high. The level will continually change until the movement goes the opposite way. Then it will settle and change its color.
The same approach takes place when the normalized value reaches "0", this time plotting a level at the low.
I hope some of you will find it useful and if so, please leave a "like" :)
Have fun, happy trading and merry Christmas :)))
开源脚本
秉承TradingView的精神,该脚本的作者将其开源,以便交易者可以查看和验证其功能。向作者致敬!您可以免费使用该脚本,但请记住,重新发布代码须遵守我们的网站规则。
🙋♂️Listed as "Trusted Pine Programmer for Hire"
💰Save $30 on your Tradingview subscription: bit.ly/3OtLyNz
🔓Indicator access: dize-trading.de/
🔒Trial access: discord.gg/DqwKjBZ8Qe
💰Save $30 on your Tradingview subscription: bit.ly/3OtLyNz
🔓Indicator access: dize-trading.de/
🔒Trial access: discord.gg/DqwKjBZ8Qe
免责声明
这些信息和出版物并非旨在提供,也不构成TradingView提供或认可的任何形式的财务、投资、交易或其他类型的建议或推荐。请阅读使用条款了解更多信息。