INVITE-ONLY SCRIPT
已更新 Weekly Fibonacci Ind. & BB (Buy & Sell)
*Description :
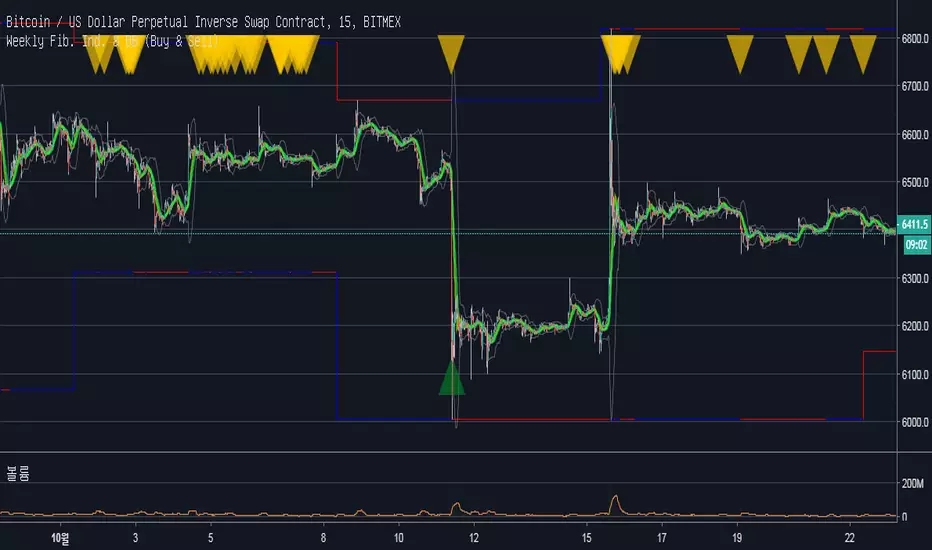
Fibonacci Retracements are used to estimate likely reversal points during an up- or down-trend. Percentage retracement levels, based on significant Fibonacci numbers, are plotted as horizontal lines against the latest trend move.
1. Blue and Red Line : The highest and lowest peak of candles.
Blue line and Red line changes colors according to the position of candles above or below the 0.5 Fibonacci Retracements line.
2. Yellow Line : 0.5 Fibonacci Retracements line.
3. Green Line : BB Basis line.
*Reference of Fibonacci Retracements :
incrediblecharts.com/help/fibonacci_retracement.php
版本注释
minor upgrades免责声明
这些信息和出版物并非旨在提供,也不构成TradingView提供或认可的任何形式的财务、投资、交易或其他类型的建议或推荐。请阅读使用条款了解更多信息。