PROTECTED SOURCE SCRIPT
已更新 RED: Momentum
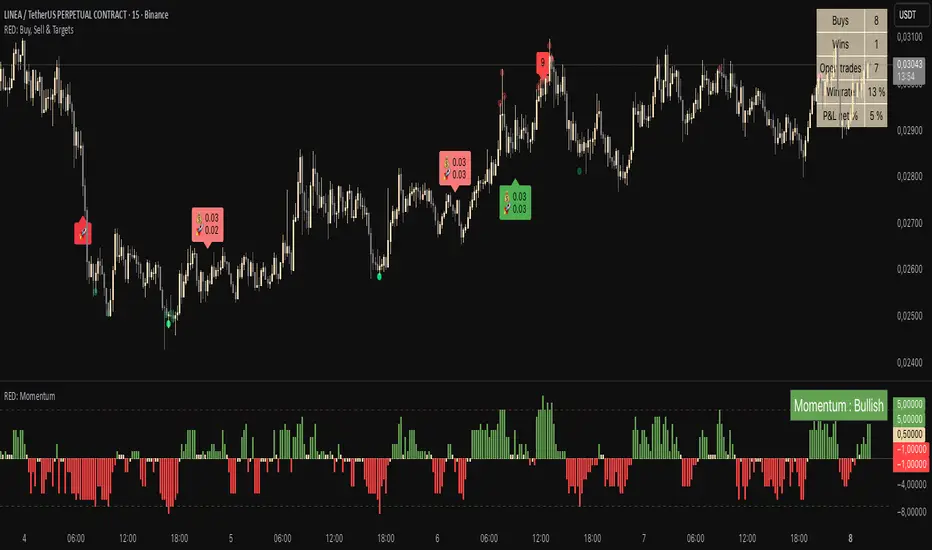
RED: Momentum Panel
This indicator is designed to track the balance of buying and selling pressure in the market and highlight key momentum phases.
It simplifies complex conditions into clear momentum states, helping traders quickly understand whether the market is in a strong zone or transitioning.
- Top zones → when selling pressure reaches extreme levels.
- Bottom zones → when buying pressure reaches extreme levels.
- Momentum Bearish → when momentum shifts down after a strong top.
- Momentum Bullish → when momentum shifts up after a strong bottom.
The panel uses a scoring system in the background to filter noise and show only the dominant side (Buy vs Sell).
Horizontal thresholds make it easy to spot when the market enters or exits extreme conditions.
This tool is not meant to give signals by itself but to provide an intuitive view of where momentum stands right now, top, bottom, bullish, or bearish, at a glance.
版本注释
Update版本注释
Update版本注释
Update版本注释
Update受保护脚本
此脚本以闭源形式发布。 但是,您可以自由使用它,没有任何限制 — 在此处了解更多信息。
免责声明
这些信息和出版物并不意味着也不构成TradingView提供或认可的金融、投资、交易或其它类型的建议或背书。请在使用条款阅读更多信息。
受保护脚本
此脚本以闭源形式发布。 但是,您可以自由使用它,没有任何限制 — 在此处了解更多信息。
免责声明
这些信息和出版物并不意味着也不构成TradingView提供或认可的金融、投资、交易或其它类型的建议或背书。请在使用条款阅读更多信息。