OPEN-SOURCE SCRIPT
CME FX Futures Correlation Matrix
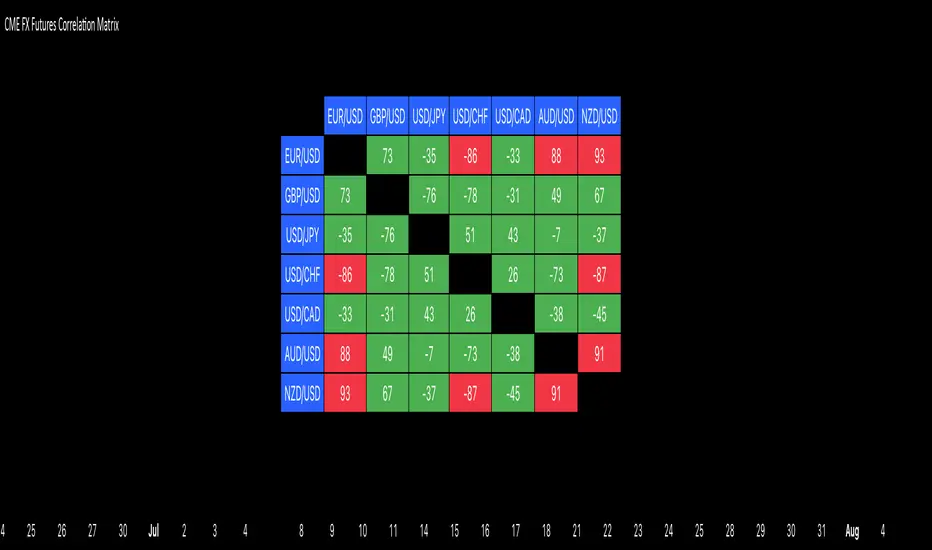
This indicator calculates the correlation between major CME FX futures and displays it in a visual table. It shows how closely pairs like EUR/USD, GBP/USD, USD/JPY, USD/CHF, USD/CAD, AUD/USD, and NZD/USD move together or in opposite directions.
The indicator inherits the timeframe of the chart it’s applied to.
Color coding:
How to launch it
The indicator inherits the timeframe of the chart it’s applied to.
Color coding:
- Red: strong correlation (absolute value > 80%), both positive and negative
- Green: moderate/low correlation
How to launch it
- Apply the indicator to a CME chart (e.g., EUR/USD futures).
- Set Numbers of Bars Back to the desired lookback period (default 100).
- The table appears in the center of the chart, showing correlation percentages between all major FX futures.
开源脚本
秉承TradingView的精神,该脚本的作者将其开源,以便交易者可以查看和验证其功能。向作者致敬!您可以免费使用该脚本,但请记住,重新发布代码须遵守我们的网站规则。
免责声明
这些信息和出版物并非旨在提供,也不构成TradingView提供或认可的任何形式的财务、投资、交易或其他类型的建议或推荐。请阅读使用条款了解更多信息。
开源脚本
秉承TradingView的精神,该脚本的作者将其开源,以便交易者可以查看和验证其功能。向作者致敬!您可以免费使用该脚本,但请记住,重新发布代码须遵守我们的网站规则。
免责声明
这些信息和出版物并非旨在提供,也不构成TradingView提供或认可的任何形式的财务、投资、交易或其他类型的建议或推荐。请阅读使用条款了解更多信息。