OPEN-SOURCE SCRIPT
volatility-adjusted breakout envelope
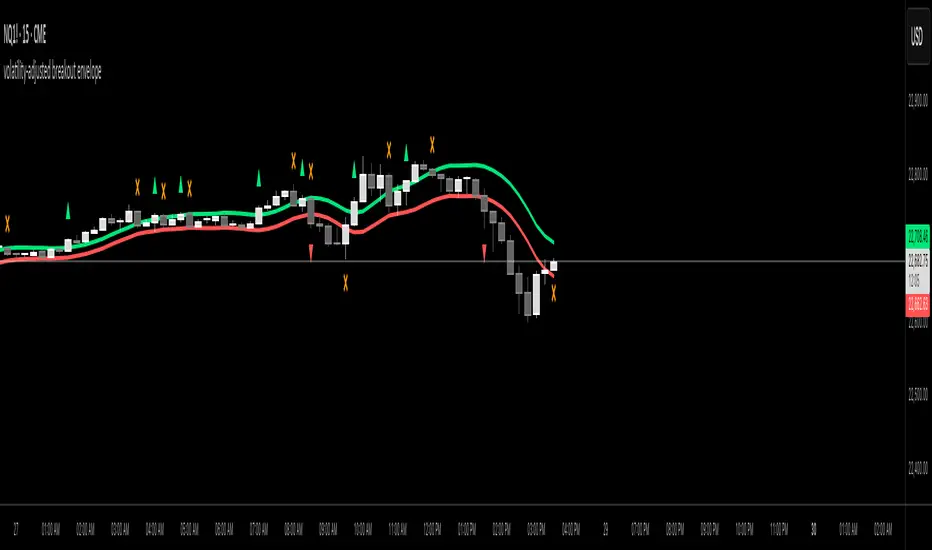
this indicator is designed to help traders visually identify potential entry and exit points based on volatility-adjusted price thresholds. it works by calculating a dynamic expected price move around the previous close using historical volatility data smoothed by exponential moving averages to reduce noise and present a clear range boundary on the chart.
the indicator first computes the logarithmic returns over a user-defined lookback period and calculates the standard deviation of these returns, which represents raw volatility. it annualizes this volatility according to the chart timeframe selected, then uses it to estimate an expected price movement for the current timeframe. this expected move is smoothed to avoid sudden spikes or drops that could cause confusing signals.
using this expected move, the indicator generates two key threshold lines: an upper threshold and a lower threshold. these lines create a volatility-based range around the smoothed previous close price. the thresholds themselves are further smoothed with exponential moving averages to produce smooth, easy-to-interpret lines that adapt to changing market conditions without being choppy.
the core trading signals are generated when the price closes outside of these smoothed threshold ranges. specifically, a long entry signal is indicated when the price closes above the upper threshold for the first time, signaling potential upward momentum beyond normal volatility expectations. a short entry signal occurs when the price closes below the lower threshold for the first time, indicating potential downward momentum.
once an entry signal is triggered, the indicator waits for the price to close back inside the threshold range before signaling an exit. when this occurs, an exit marker is displayed to indicate that the price has returned within normal volatility bounds, which may suggest that the previous trend is losing strength or the breakout has ended.
these signals are visually represented on the chart using small shapes: triangles pointing upwards mark the initial long entries, triangles pointing downwards mark short entries, and x shapes mark the exits for both long and short positions. the colors of these shapes are customizable to suit user preferences.
to use this indicator effectively, traders should watch for the first close outside the smoothed volatility range to consider entering a position in the breakout direction. the exit signals help identify when price action reverts back into the expected range, which can be used to close or reduce the position. this method emphasizes trading breakouts supported by statistically significant moves relative to recent volatility while providing a clear exit discipline.
this indicator is best applied to intraday or daily charts with consistent volatility and volume characteristics. users should adjust the volatility lookback period, smoothing factor, and trading session times to match their specific market and trading style. because it relies on price volatility rather than fixed price levels, it can adapt to changing market conditions but should be combined with other analysis tools and proper risk management.
overall, this indicator provides a smoothed, dynamic volatility envelope with clear visual entry and exit cues based on first closes outside and back inside these envelopes, making it a helpful assistant for manual traders seeking to capture statistically significant breakouts while maintaining disciplined exits.
开源脚本
秉承TradingView的精神,该脚本的作者将其开源,以便交易者可以查看和验证其功能。向作者致敬!您可以免费使用该脚本,但请记住,重新发布代码须遵守我们的网站规则。
免责声明
这些信息和出版物并非旨在提供,也不构成TradingView提供或认可的任何形式的财务、投资、交易或其他类型的建议或推荐。请阅读使用条款了解更多信息。
开源脚本
秉承TradingView的精神,该脚本的作者将其开源,以便交易者可以查看和验证其功能。向作者致敬!您可以免费使用该脚本,但请记住,重新发布代码须遵守我们的网站规则。
免责声明
这些信息和出版物并非旨在提供,也不构成TradingView提供或认可的任何形式的财务、投资、交易或其他类型的建议或推荐。请阅读使用条款了解更多信息。