OPEN-SOURCE SCRIPT
Rolling Range Bands by tvig

Rolling Range Bands
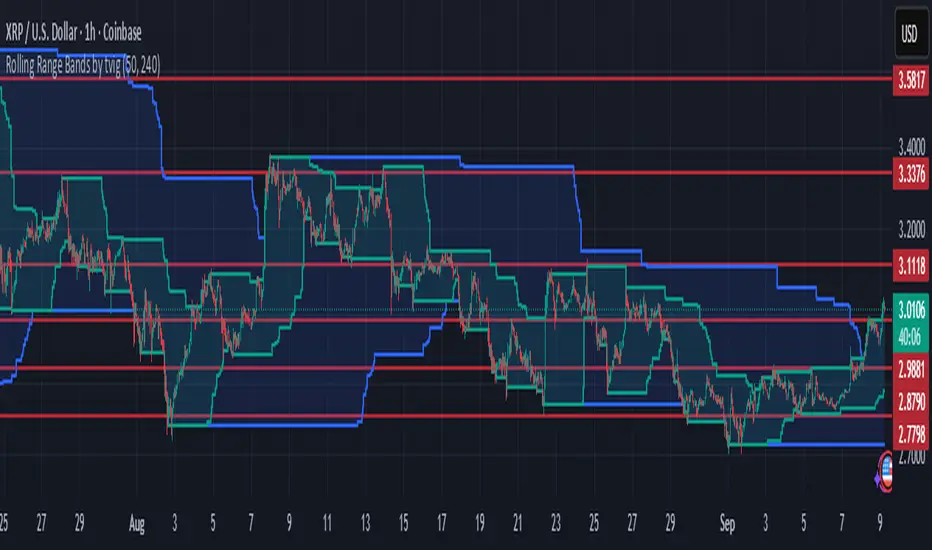
Plots two dynamic price envelopes that track the highest and lowest prices over a Short and Long lookback. Use them to see near-term vs. broader market structure, evolving support/resistance, and volatility changes at a glance.
What it shows
• Short Bands: recent trading range (fast, more reactive).
• Long Bands: broader range (slow, structural).
• Optional step-line style and shaded zones for clarity.
• Option to use completed bar values to avoid intrabar jitter (no repaint).
How to read
• Price pressing the short high while the long band rises → short-term momentum in a larger uptrend.
• Price riding the short low inside a falling long band → weakness with trend alignment.
• Band squeeze (narrowing) → compression; watch for breakout.
• Band expansion (widening) → rising volatility; expect larger swings.
• Repeated touches/rejections of long bands → potential areas of support/resistance.
Inputs
• Short Window, Long Window (bars)
• Use Close only (vs. High/Low)
• Use completed bar values (stability)
• Step-line style and Band shading
Tips
• Works on any symbol/timeframe; tune windows to your market.
• For consistent scaling, pin the indicator to the same right price scale as the chart.
Not financial advice; combine with trend/volume/RSI or your system for entries/exits.
开源脚本
秉承TradingView的精神,该脚本的作者将其开源,以便交易者可以查看和验证其功能。向作者致敬!您可以免费使用该脚本,但请记住,重新发布代码须遵守我们的网站规则。
免责声明
这些信息和出版物并非旨在提供,也不构成TradingView提供或认可的任何形式的财务、投资、交易或其他类型的建议或推荐。请阅读使用条款了解更多信息。
开源脚本
秉承TradingView的精神,该脚本的作者将其开源,以便交易者可以查看和验证其功能。向作者致敬!您可以免费使用该脚本,但请记住,重新发布代码须遵守我们的网站规则。
免责声明
这些信息和出版物并非旨在提供,也不构成TradingView提供或认可的任何形式的财务、投资、交易或其他类型的建议或推荐。请阅读使用条款了解更多信息。