PROTECTED SOURCE SCRIPT
Delta Histogram - OnlyFlow
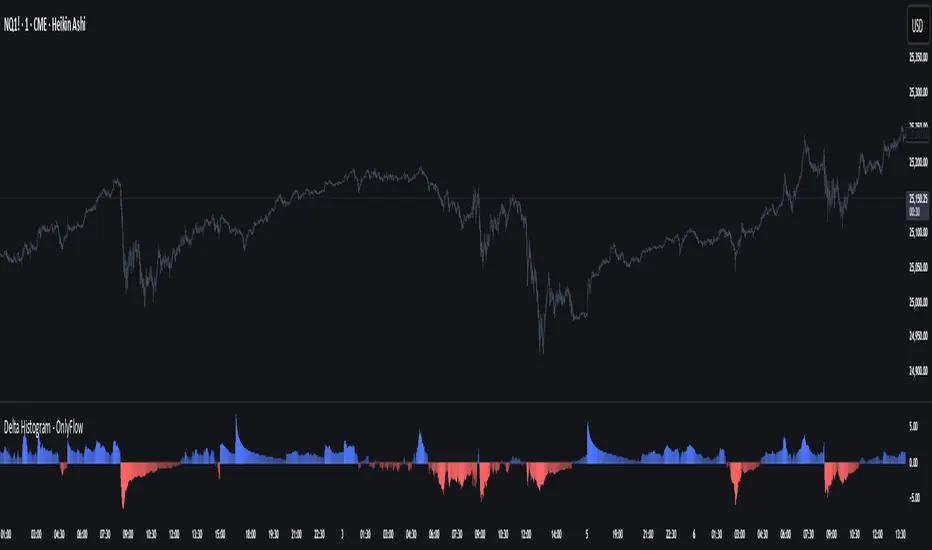
This script plots a histogram of delta proxies (approximations of buying vs. selling pressure) using available chart data. Because TradingView does not provide bid/ask tape data, delta is estimated with several selectable methods:
Uptick/Down-tick (proxy): volume signed by close direction.
Body-weighted Volume: weights volume by candle body relative to its range.
VWAP-slope Volume: signs volume by changes in the typical price (HLC3).
Features
Cumulative or per-bar mode: reset daily or by custom session hours.
Normalization options: Z-score, percentile scaling, or raw values; with percentile clipping for stable colors and axis scaling.
Visualization: color-coded positive/negative bars, optional zero line and ± bands, adjustable opacity scaling.
Readout Panel: shows the latest delta values and their normalized equivalents on the chart edge.
Alerts: triggers when normalized delta exceeds positive or negative thresholds, highlighting potential spikes in pressure.
Usage
Switch between delta modes to explore different perspectives on order-flow imbalance. Cumulative mode shows whether pressure builds over a session, while per-bar mode highlights bar-to-bar shifts. Normalization helps identify relative extremes in context rather than raw values.
受保护脚本
此脚本以闭源形式发布。 但是,您可以自由使用,没有任何限制 — 了解更多信息这里。
免责声明
这些信息和出版物并非旨在提供,也不构成TradingView提供或认可的任何形式的财务、投资、交易或其他类型的建议或推荐。请阅读使用条款了解更多信息。
免责声明
这些信息和出版物并非旨在提供,也不构成TradingView提供或认可的任何形式的财务、投资、交易或其他类型的建议或推荐。请阅读使用条款了解更多信息。