INVITE-ONLY SCRIPT
PipsToEMA200StatsV1.0
Creator: Andrew Palladino
Date: 5/20/2017
Description:
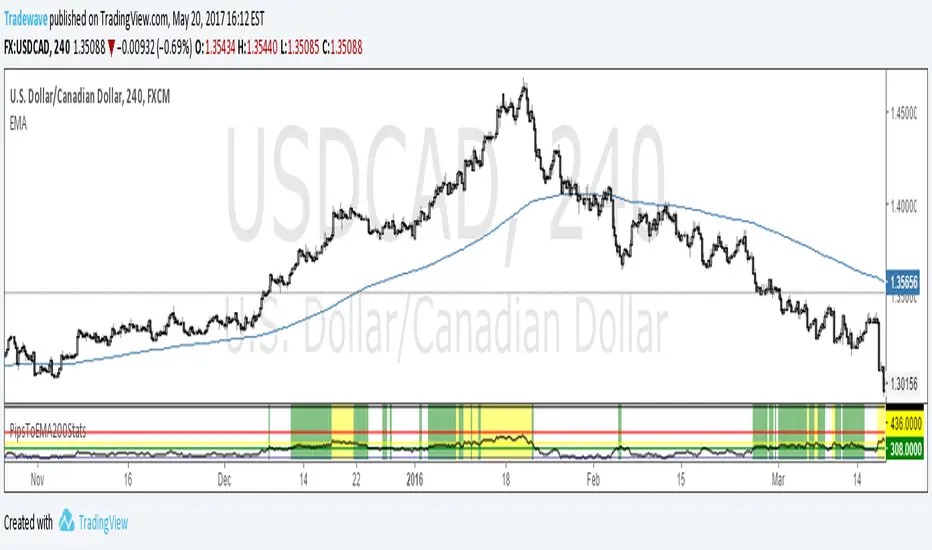
Plots distance in pips to 200 EMA .
Displays thresholds for vertical pip distance to 200 EMA calculated from 10 years worth of historical data.
Currently only working the following pairs:
"AUDCAD", "AUDCHF", "AUDJPY", "AUDNZD", "AUDSGD", "CADCHF", "CADJPY", "CHFJPY", "CHFSGD", "EURAUD", "EURCAD", "EURGBP", "EURJPY", "EURMXN", "EURNOK", "EURNZD", "EURUSD", "GBPAUD", "GBPCAD", "GBPCHF", "GBPJPY", "GBPNZD", "GBPNZD", "GBPUSD","NZDCAD", "NZDCHF", "NZDJPY", "NZDUSD", "USDCAD", "USDCHF", "USDJPY", "USDMXN"
Currently only working for the following time frames: m5, m15, h1, h4.
Current thresholds are set to:
90th percentile (green line)
95th percentile (yellow line)
99th percentile (orange line)
100th percentile (black line)
The oscillator measures vertical pip distance to 200 EMA . (BLACK LINE)
The trader has the ability to turn on/off the 4 thresholds in input properties.
The indicator background will turn green when pip distance is above green threshold and below yellow threshold.
The indicator background will turn yellow when pip distance is above yellow threshold and below red threshold.
The indicator background will turn red when pip distance is above red threshold
Date: 5/20/2017
Description:
Plots distance in pips to 200 EMA .
Displays thresholds for vertical pip distance to 200 EMA calculated from 10 years worth of historical data.
Currently only working the following pairs:
"AUDCAD", "AUDCHF", "AUDJPY", "AUDNZD", "AUDSGD", "CADCHF", "CADJPY", "CHFJPY", "CHFSGD", "EURAUD", "EURCAD", "EURGBP", "EURJPY", "EURMXN", "EURNOK", "EURNZD", "EURUSD", "GBPAUD", "GBPCAD", "GBPCHF", "GBPJPY", "GBPNZD", "GBPNZD", "GBPUSD","NZDCAD", "NZDCHF", "NZDJPY", "NZDUSD", "USDCAD", "USDCHF", "USDJPY", "USDMXN"
Currently only working for the following time frames: m5, m15, h1, h4.
Current thresholds are set to:
90th percentile (green line)
95th percentile (yellow line)
99th percentile (orange line)
100th percentile (black line)
The oscillator measures vertical pip distance to 200 EMA . (BLACK LINE)
The trader has the ability to turn on/off the 4 thresholds in input properties.
The indicator background will turn green when pip distance is above green threshold and below yellow threshold.
The indicator background will turn yellow when pip distance is above yellow threshold and below red threshold.
The indicator background will turn red when pip distance is above red threshold
仅限邀请脚本
只有作者授权的用户才能访问此脚本。您需要申请并获得使用许可。通常情况下,付款后即可获得许可。更多详情,请按照下方作者的说明操作,或直接联系LiquidityTracker。
TradingView不建议您付费购买或使用任何脚本,除非您完全信任其作者并了解其工作原理。您也可以在我们的社区脚本找到免费的开源替代方案。
作者的说明
免责声明
这些信息和出版物并非旨在提供,也不构成TradingView提供或认可的任何形式的财务、投资、交易或其他类型的建议或推荐。请阅读使用条款了解更多信息。
仅限邀请脚本
只有作者授权的用户才能访问此脚本。您需要申请并获得使用许可。通常情况下,付款后即可获得许可。更多详情,请按照下方作者的说明操作,或直接联系LiquidityTracker。
TradingView不建议您付费购买或使用任何脚本,除非您完全信任其作者并了解其工作原理。您也可以在我们的社区脚本找到免费的开源替代方案。
作者的说明
免责声明
这些信息和出版物并非旨在提供,也不构成TradingView提供或认可的任何形式的财务、投资、交易或其他类型的建议或推荐。请阅读使用条款了解更多信息。