OPEN-SOURCE SCRIPT
已更新 ORB-5Min + Adaptive 12/48 EMA + PDH/PDL
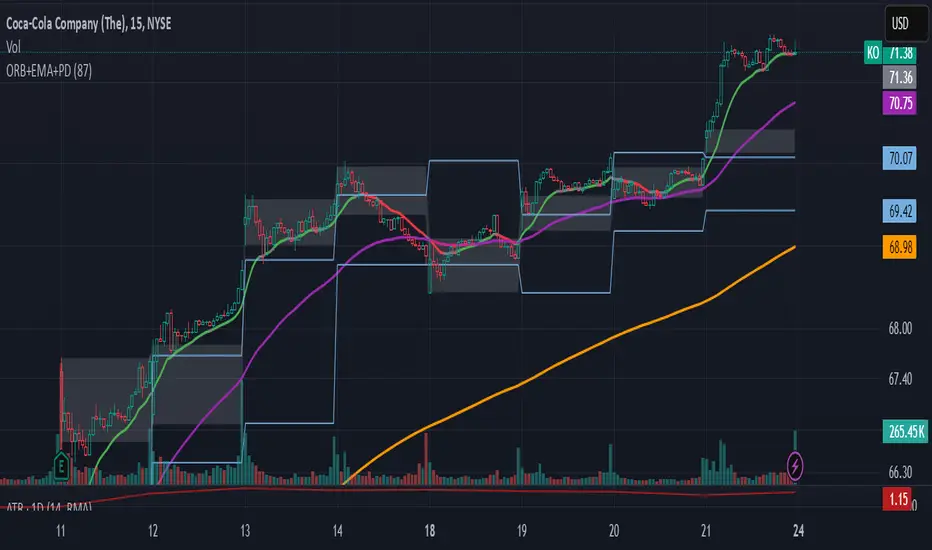
Overview:
This indicator combines the 5-Minute Opening Range Breakout (ORB), Adaptive 12/48 Exponential Moving Averages (EMAs), and Previous Day High/Low (PDH/PDL) levels to help traders identify key intraday levels and market trends.
Key Components and Logic:
5-Minute Opening Range Breakout (ORB):
- Displays the high and low from the first 5-minute candle of the trading session.
- Includes customizable opacity for the range fill.
- Helps traders spot breakout opportunities and key support/resistance zones.
Adaptive 12/48 EMA System:
- Displays EMAs for 9, 12, 48, and 200 periods.
- The 12 EMA changes color based on whether the price is entirely above or below it.
- The 48 EMA changes color depending on its relationship with the 12 EMA.
- Provides dynamic trend identification and potential entry/exit signals.
Previous Day High/Low (PDH/PDL):
- Displays the previous day’s high and low levels.
- Useful for tracking key intraday support/resistance levels and potential reversal points.
Summary:
This script stands out by blending three popular intraday tools into a single comprehensive indicator. The combined visualization provides a layered market context that assists traders in making informed decisions quickly. The color-adaptive EMAs add clarity to trend direction, while the ORB and PDH/PDL levels highlight significant price zones for breakout or reversal trades.
How to Use:
Breakout Trades: Watch for price breaks above the ORB high or below the ORB low, especially when supported by EMA trends.
Trend Confirmation: Use the color-adaptive 12/48 EMA system to gauge momentum and market direction.
Reversal or Continuation: Observe how price reacts around PDH/PDL levels, especially if confluence with EMAs occurs.
This indicator is suitable for day traders seeking a clear and efficient way to track market structure, identify trends, and spot potential trade opportunities during regular market hours.
版本注释
Overview:This indicator combines the 5-Minute Opening Range Breakout (ORB), Adaptive 12/48 Exponential Moving Averages (EMAs) along with an optional 9 and 200 ema, and Previous Day High/Low (PDH/PDL) levels to help traders identify key intraday levels and market trends.
Key Components and Logic:
5-Minute Opening Range Breakout (ORB):
- Displays the high and low from the first 5-minute candle of the trading session.
- Includes customizable opacity for the range fill.
- Helps traders spot breakout opportunities and key support/resistance zones.
Adaptive 12/48 EMA System:
- Displays EMAs for 9, 12, 48, and 200 periods.
- The 12 EMA changes color based on whether the price is entirely above or below it.
- The 48 EMA changes color depending on its relationship with the 12 EMA.
- Provides dynamic trend identification and potential entry/exit signals.
Previous Day High/Low (PDH/PDL):
- Displays the previous day’s high and low levels.
- Useful for tracking key intraday support/resistance levels and potential reversal points.
Summary:
This script stands out by blending three popular intraday tools into a single comprehensive indicator. The combined visualization provides a layered market context that assists traders in making informed decisions quickly through a back tested strategy. The color-adaptive EMAs add clarity to trend direction, while the ORB and PDH/PDL levels highlight significant price zones for breakout or reversal trades.
How to Use:
Breakout Trades: Watch for price breaks above the ORB high or below the ORB low, especially when supported by EMA trends.
Trend Confirmation: Use the color-adaptive 12/48 EMA system to gauge momentum and market direction.
Reversal or Continuation: Observe how price reacts around PDH/PDL levels, especially if confluence with EMAs occurs.
Note: Settings to keep a simple and aesthetic setup include an opacity of 87 for the ORB range, leaving the plots for the top and bottom of the ORB range OFF (leaving only the range), and keeping only the 12ema to keep a simple short-term trend identification. Adding the 9,48, and 200 may be used for a shorter or longer trend confluence on any timeframe. Settings are easily customizable, allowing traders to tailor the indicator for a clear and personalized visualization of their preferred setup.
This indicator is suitable for day traders seeking a clear and efficient way to track market structure, identify trends, and spot potential trade opportunities during regular market hours.
开源脚本
秉承TradingView的精神,该脚本的作者将其开源,以便交易者可以查看和验证其功能。向作者致敬!您可以免费使用该脚本,但请记住,重新发布代码须遵守我们的网站规则。
免责声明
这些信息和出版物并非旨在提供,也不构成TradingView提供或认可的任何形式的财务、投资、交易或其他类型的建议或推荐。请阅读使用条款了解更多信息。
开源脚本
秉承TradingView的精神,该脚本的作者将其开源,以便交易者可以查看和验证其功能。向作者致敬!您可以免费使用该脚本,但请记住,重新发布代码须遵守我们的网站规则。
免责声明
这些信息和出版物并非旨在提供,也不构成TradingView提供或认可的任何形式的财务、投资、交易或其他类型的建议或推荐。请阅读使用条款了解更多信息。