PROTECTED SOURCE SCRIPT
已更新 Higher Timeframe Candle Overlay
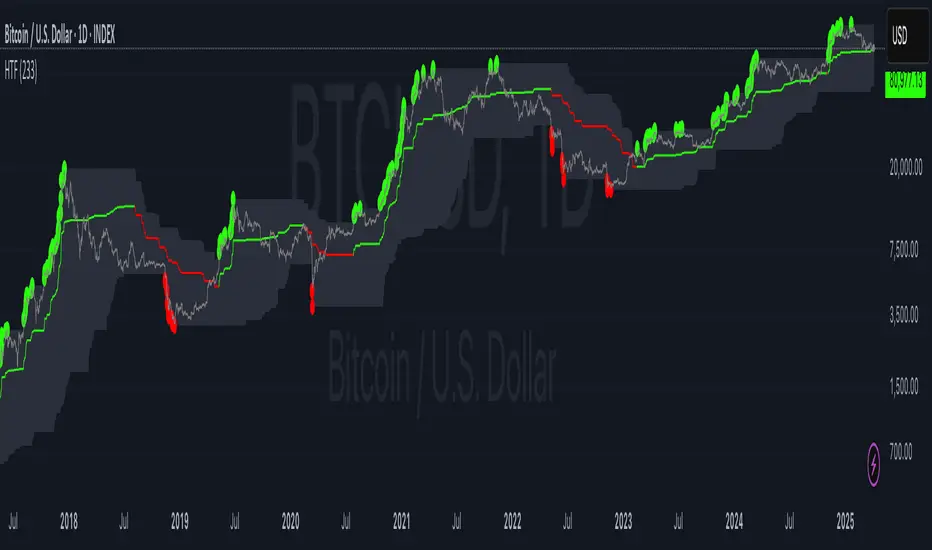
Hi all, this script helps you to see candle of any timeframe at the same time. It is possible to find the regions of dying trend by peeking into the higher timeframe candles. For example, on a 1-min chart, a 1439 min ( (24*60) - 1 ) candle is a day candle refernce to that 1-min. If huge bodied candles starts to grow larger wicks and smaller bodies, it means that the trend is dying.
版本注释
- Optimised code
- Cleaned up charting
版本注释
Added colouring inputDisplayed higher timeframe candle's Bullish Highs, Bearish Lows and Median price levels
版本注释
- Displayed HTF Candles based areas of lower and higher prices
版本注释
- Fixed typos
版本注释
Updated to PineScript v6版本注释
+Added colours for median line受保护脚本
此脚本以闭源形式发布。 但是,您可以自由使用,没有任何限制 — 了解更多信息这里。
免责声明
这些信息和出版物并非旨在提供,也不构成TradingView提供或认可的任何形式的财务、投资、交易或其他类型的建议或推荐。请阅读使用条款了解更多信息。
受保护脚本
此脚本以闭源形式发布。 但是,您可以自由使用,没有任何限制 — 了解更多信息这里。
免责声明
这些信息和出版物并非旨在提供,也不构成TradingView提供或认可的任何形式的财务、投资、交易或其他类型的建议或推荐。请阅读使用条款了解更多信息。