OPEN-SOURCE SCRIPT
Slope
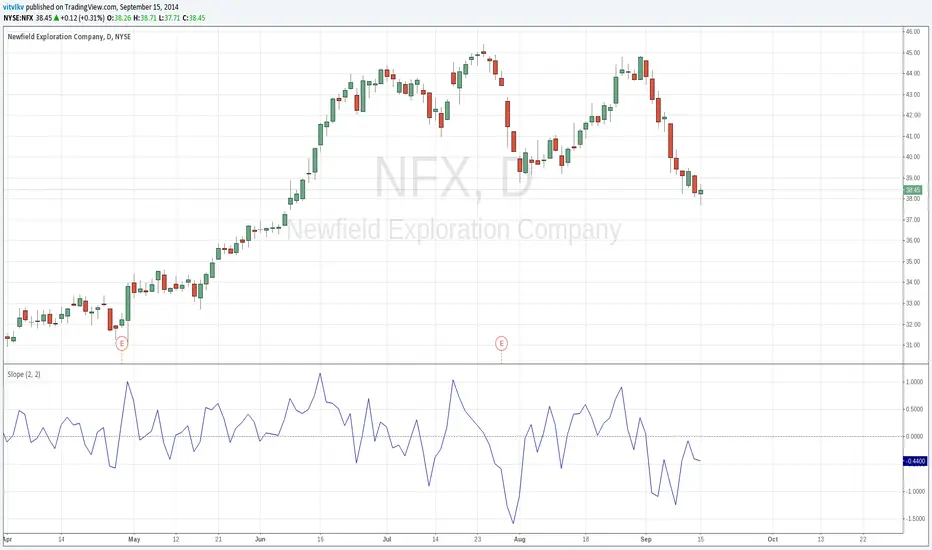
The slope indicator measures the rise-over-run of a linear regression, which is the line of best fit for a price series. Fluctuating above and below zero, the Slope indicator best resembles a momentum oscillator without boundaries. It is not well suited for overbought/oversold levels, but can measure the direction and strength of a trend. It can also be used with other indicators do identify potential entry points within an ongoing trend. (stockcharts.com/school/doku.php?id=chart_school:technical_indicators:slope)
开源脚本
秉承TradingView的精神,该脚本的作者将其开源,以便交易者可以查看和验证其功能。向作者致敬!您可以免费使用该脚本,但请记住,重新发布代码须遵守我们的网站规则。
免责声明
这些信息和出版物并非旨在提供,也不构成TradingView提供或认可的任何形式的财务、投资、交易或其他类型的建议或推荐。请阅读使用条款了解更多信息。
免责声明
这些信息和出版物并非旨在提供,也不构成TradingView提供或认可的任何形式的财务、投资、交易或其他类型的建议或推荐。请阅读使用条款了解更多信息。