PROTECTED SOURCE SCRIPT
Fetch Trends

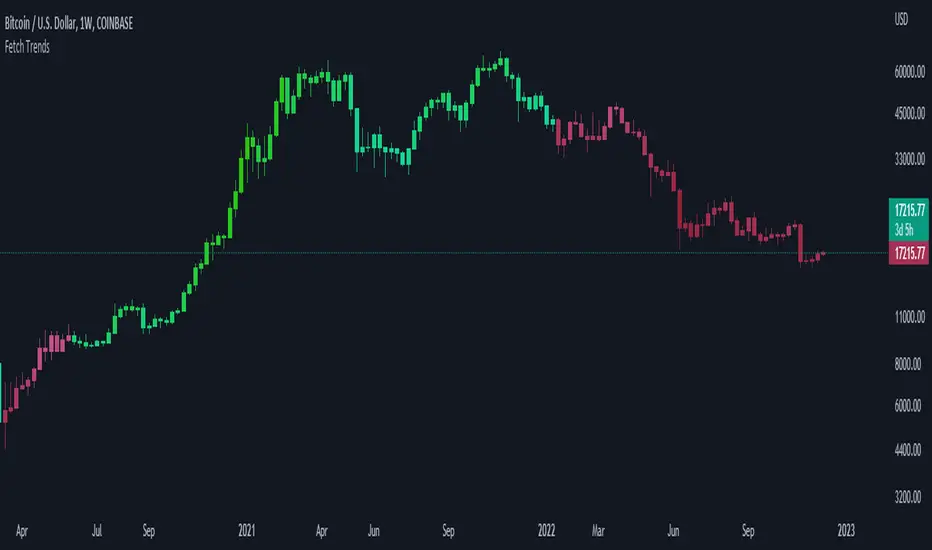
This indicator can be used as a tool to measure the strength of the current trend. It is also trying to achieve to alert traders on when a trend can shift.
In order to achieve this, it uses three simple indicators:
1: 9 Simple moving average
2: 50 Simple moving average
3: Rsi (14)
The moving averages are used to define the current trend of the market, and the rsi is used to measure the strength. We use a color gradient to reach our second goal with this indicator.
The gradient is calculated based on the rsi value, which means the trader can use this indicator to visualize the strength of the current trend. It also helps to alert the trader when the trend starts to shift.
Lets say we use green to signal a strong positive trend, and blue for a weak positive trend. The candles are green in a strong uptrend, and are getting more blue once the trend starts to weaken.
As soon as the trend shifts from bullish to bearish, the bars become a diferent color.
受保护脚本
此脚本以闭源形式发布。 但是,您可以自由使用,没有任何限制 — 了解更多信息这里。
免责声明
这些信息和出版物并非旨在提供,也不构成TradingView提供或认可的任何形式的财务、投资、交易或其他类型的建议或推荐。请阅读使用条款了解更多信息。
受保护脚本
此脚本以闭源形式发布。 但是,您可以自由使用,没有任何限制 — 了解更多信息这里。
免责声明
这些信息和出版物并非旨在提供,也不构成TradingView提供或认可的任何形式的财务、投资、交易或其他类型的建议或推荐。请阅读使用条款了解更多信息。