OPEN-SOURCE SCRIPT
Calvin Moving Averages
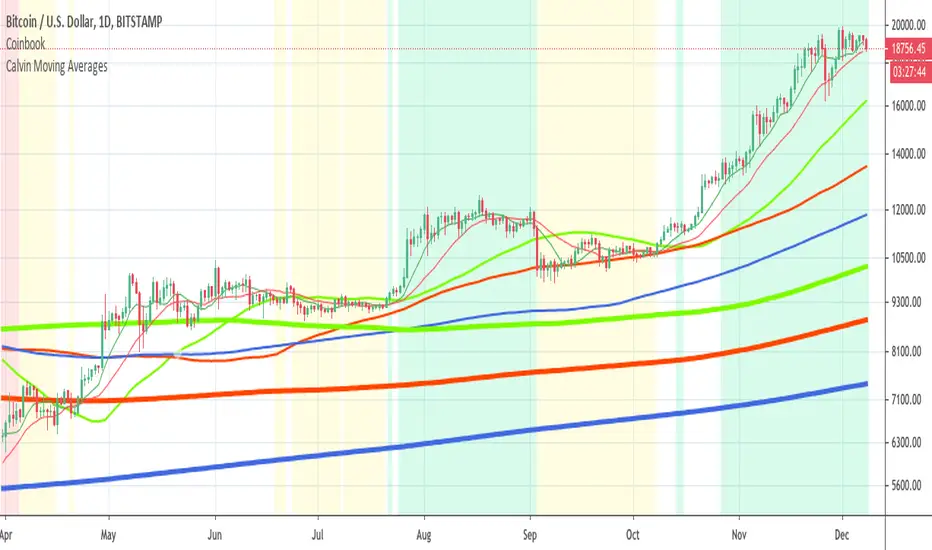
This is Coinbook's major indicator complete with red, yellow, and green zones. The major moving averages are also displayed.
The red zone is where the close is less than the 50 day sma, which is less than the 100 day sma, which is less than the 200 day sma. The slope of the 50 & 100 day smas are sloping down. The green zone is the exact opposite where the close is greater than the 50 day sma, which is greater than the 100 day sma, which is greater than the 200 day sma. The slope of the 50 & 100 in this case are both sloping upward. We get into a yellow zone when we are below the 50 and when we are not in a green or yellow zone. The white zone is everything else.
The main idea is that when we exit the red zone, generally that is a very good place to enter a trade. When we exit the green zone we usually want to sell. There are many nuances and exceptions which are explained during the conversations at the Coinbook YouTube channel: youtube.com/channel/UCKk80C6quLfQMBHvN0cX5Rg
Best of luck in your trading!
If this indicator helps you or you are just feeling generous please send a donation. Thanks! You guys are awesome :)
BTC: 35LxBrVYq2t2m3dNmB3nRhhW25yydwUqH9
LTC: MFD7rE5AYCUh521Wwg9vcNoFUihFpQWPhB
DGB: Sk7zjXdZd7nWWcnnrcGwVcWREL8daBE7eC
ETH: 0x412B6152cd05B331D45e22C5A4a5b2aa6396d8Cb
BCH: qpnypx6u333tkzyk4fy99c2fhhtedpje5cslamzw4c
DOGE: DGHHTSVHLfd1jQgtqYkmLDh8CYQZhrpnrE
开源脚本
In true TradingView spirit, the creator of this script has made it open-source, so that traders can review and verify its functionality. Kudos to the author! While you can use it for free, remember that republishing the code is subject to our House Rules.
免责声明
The information and publications are not meant to be, and do not constitute, financial, investment, trading, or other types of advice or recommendations supplied or endorsed by TradingView. Read more in the Terms of Use.