OPEN-SOURCE SCRIPT
已更新 Logarithmic Volume
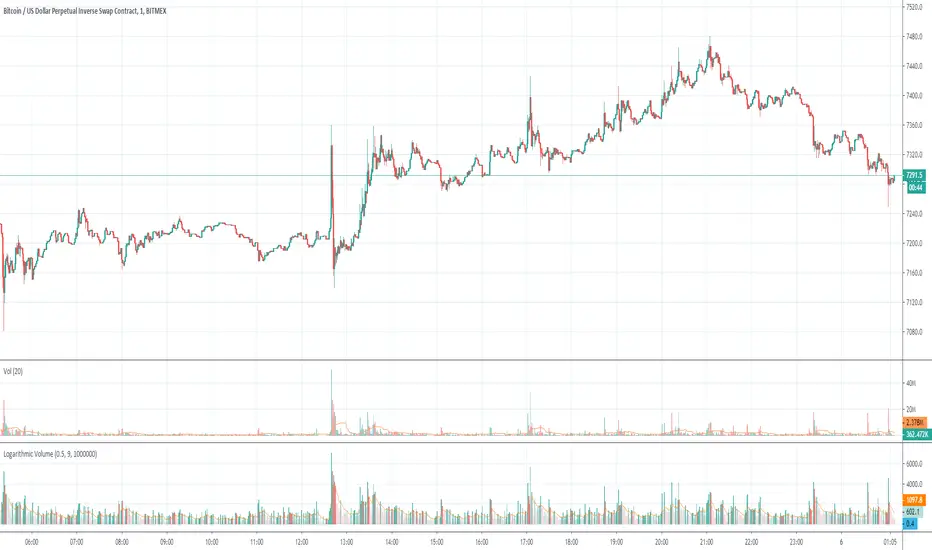
In volatile markets, normal indicator suffer from volume spikes that make the rest of plot seem non-existent.
Using logarithmic exponent, this indicator normalizes the volume, so this makes it easier to read.
The obvious drawback is that it does not display the actual volume amount, only a relative value.
Using logarithmic exponent, this indicator normalizes the volume, so this makes it easier to read.
The obvious drawback is that it does not display the actual volume amount, only a relative value.
版本注释
Included the original volume indicator in the screenshot so you can see the difference.版本注释
Fixed incorrect bar colors, note: it's actually intended to be green on rising volume and red on declining volume.版本注释
I found the way to include the original volume data on the chart!The actual volume is being divided by a large number, so it doesn't break the chart.
The outcome value is small and transparent, yet it's still printed on the chart.
In this example it is divided by 1000000 or one million bitmex contracts.
开源脚本
秉承TradingView的精神,该脚本的作者将其开源,以便交易者可以查看和验证其功能。向作者致敬!您可以免费使用该脚本,但请记住,重新发布代码须遵守我们的网站规则。
免责声明
这些信息和出版物并非旨在提供,也不构成TradingView提供或认可的任何形式的财务、投资、交易或其他类型的建议或推荐。请阅读使用条款了解更多信息。
免责声明
这些信息和出版物并非旨在提供,也不构成TradingView提供或认可的任何形式的财务、投资、交易或其他类型的建议或推荐。请阅读使用条款了解更多信息。