OPEN-SOURCE SCRIPT
Auto Fibonacci Lines
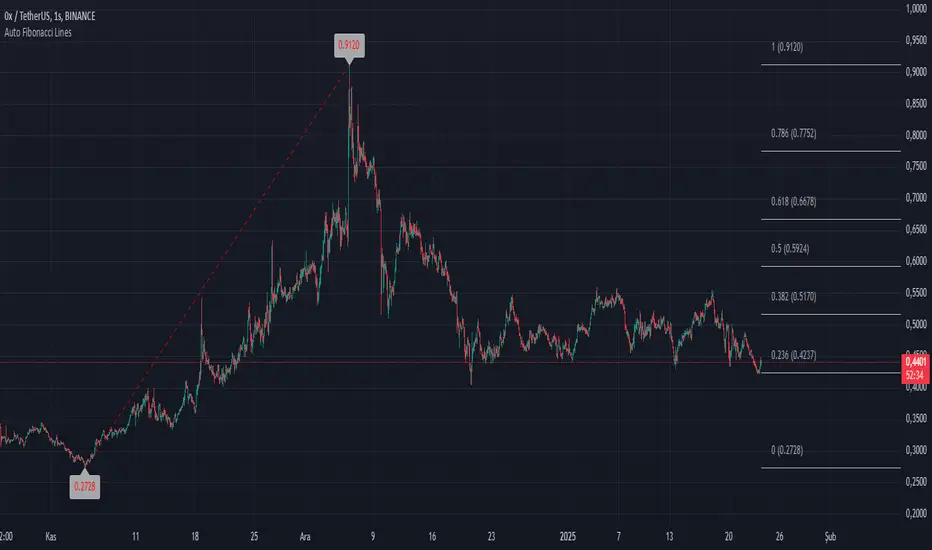
This TradingView script is a modded version of the library called "VisibleChart" created by Pinecoder.
This version has the option for users to change the Fibonacci lines and price labels. This makes the script user-friendly.
Fibonacci extensions are a tool that traders can use to establish profit targets or estimate how far a price may travel after a retracement/pullback is finished. Extension levels are also possible areas where the price may reverse. This study automatically draws horizontal lines that are used to determine possible support and resistance levels.
It's designed to automatically plot Fibonacci retracement levels on chart, aiding in technical analysis for traders.
First, the highest and lowest bars on the chart are calculated. These values are used for Fibonacci extensions.
These values update as traders scroll or zoom their charts, this shows that it is a useful indicator that can dynamically calculate and draw visuals on visible bars only.
开源脚本
秉承TradingView的精神,该脚本的作者将其开源,以便交易者可以查看和验证其功能。向作者致敬!您可以免费使用该脚本,但请记住,重新发布代码须遵守我们的网站规则。
免责声明
这些信息和出版物并非旨在提供,也不构成TradingView提供或认可的任何形式的财务、投资、交易或其他类型的建议或推荐。请阅读使用条款了解更多信息。
开源脚本
秉承TradingView的精神,该脚本的作者将其开源,以便交易者可以查看和验证其功能。向作者致敬!您可以免费使用该脚本,但请记住,重新发布代码须遵守我们的网站规则。
免责声明
这些信息和出版物并非旨在提供,也不构成TradingView提供或认可的任何形式的财务、投资、交易或其他类型的建议或推荐。请阅读使用条款了解更多信息。