OPEN-SOURCE SCRIPT
SSRO Z-Score
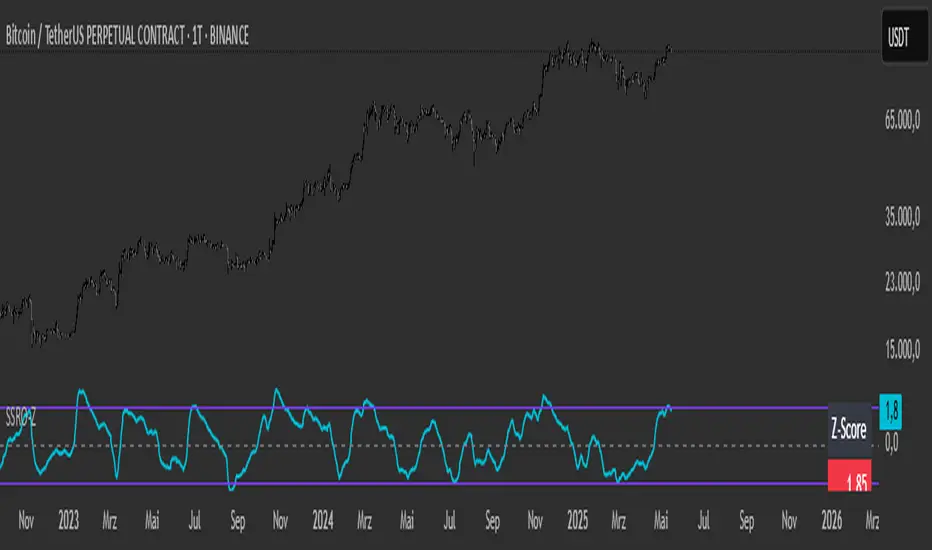
SSRO Z-Score Indicator — Description
What it does:
This indicator measures the Stablecoin Supply Ratio (SSR) relative to Bitcoin’s market cap and calculates a normalized Z-Score of this ratio to help identify potential market tops and bottoms in the crypto market.
How it works:
The Stablecoin Supply Ratio (SSR) is calculated by dividing Bitcoin’s market capitalization by the combined market capitalization of major stablecoins (USDT, USDC, TUSD, DAI, FRAX).
The SSR is then smoothed over a user-defined lookback period to reduce noise.
A Z-Score is computed by normalizing the SSR over a specified moving window, which shows how far the current SSR deviates from its historical average in terms of standard deviations.
This Z-Score is further smoothed using an exponential moving average (EMA) to filter short-term volatility.
How to read the Z-Score:
Z-Score = 0: SSR is at its historical average.
Z-Score > 0: SSR is above average, indicating Bitcoin’s market cap is relatively high compared to stablecoin supply, potentially signaling bullish market conditions.
Z-Score < 0: SSR is below average, indicating stablecoin supply is high relative to Bitcoin’s market cap, possibly signaling bearish pressure or increased liquidity waiting to enter the market.
Upper and Lower Bands: These user-defined levels (e.g., +2 and -2) represent thresholds for extreme conditions. Values above the upper band may indicate overbought or overheated market conditions, while values below the lower band may indicate oversold or undervalued conditions.
Additional Features:
A dynamic table displays a linear scaled Z-Score alongside the main plot, clamped between -2 and +2 relative to the upper and lower bands for intuitive interpretation.
Usage Tips:
Combine the SSRO Z-Score with other technical indicators or volume analysis for more reliable signals.
Look for divergence between price and Z-Score extremes as potential reversal signals.
开源脚本
秉承TradingView的精神,该脚本的作者将其开源,以便交易者可以查看和验证其功能。向作者致敬!您可以免费使用该脚本,但请记住,重新发布代码须遵守我们的网站规则。
免责声明
这些信息和出版物并非旨在提供,也不构成TradingView提供或认可的任何形式的财务、投资、交易或其他类型的建议或推荐。请阅读使用条款了解更多信息。
开源脚本
秉承TradingView的精神,该脚本的作者将其开源,以便交易者可以查看和验证其功能。向作者致敬!您可以免费使用该脚本,但请记住,重新发布代码须遵守我们的网站规则。
免责声明
这些信息和出版物并非旨在提供,也不构成TradingView提供或认可的任何形式的财务、投资、交易或其他类型的建议或推荐。请阅读使用条款了解更多信息。