PROTECTED SOURCE SCRIPT
已更新 CFX - Plot HTF Bar
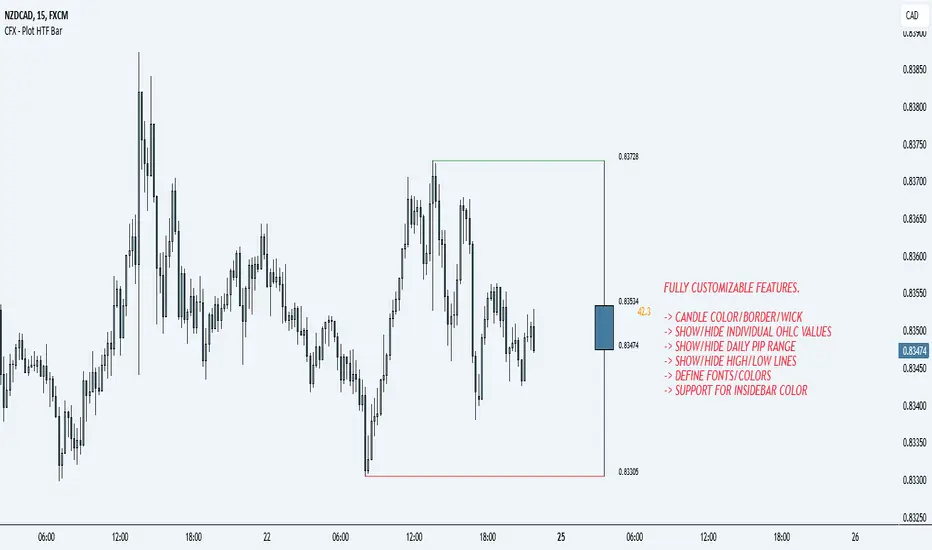
If you lose track of what's going on while being on the lower timeframes, you can use this indicator in order to plot the higher timeframe bar to the right hand side of the chart.
Supports multiple timeframes
Supports different colors
Supports different color for inside bars
Supports toggle-able pip range
Supports multiple timeframes
Supports different colors
Supports different color for inside bars
Supports toggle-able pip range
版本注释
Updated to fix bugs and contain new features.版本注释
Added new features, made everything customizable.New Features:
- Individual high/low lines that can be configured for colors/styles
- OHLC values that can be individually turned on/off and adjusted for font/color
- Plotted Bar Pip Range text that can be adjusted for font/color
- Defined logic for bar visible on higher timeframes than the input value.
Known Issues:
- Going on a lower timeframe(seconds) with too large of an input timeframe on the candle will cause top/high lines not to display. This is due to a limitation of tradingview's max candles to look back
Changelog:
- Candle draw logic has been heavily simplified which should make it faster.
Feel free to leave suggestions/post if there are any issues.
I will do my best to look into it and fix it as I actively use this indicator myself.
~Cold
版本注释
Fixed high/low drawing logic. In previous version it was influenced by the brokers.FXCM and others that have very slight price gaps/differences on various time frames were not showing properly. It should now be fixed.
版本注释
Features are now a checkbox instead of a drop down ON/OFF受保护脚本
此脚本以闭源形式发布。 但是,您可以自由使用,没有任何限制 — 了解更多信息这里。
免责声明
这些信息和出版物并非旨在提供,也不构成TradingView提供或认可的任何形式的财务、投资、交易或其他类型的建议或推荐。请阅读使用条款了解更多信息。
受保护脚本
此脚本以闭源形式发布。 但是,您可以自由使用,没有任何限制 — 了解更多信息这里。
免责声明
这些信息和出版物并非旨在提供,也不构成TradingView提供或认可的任何形式的财务、投资、交易或其他类型的建议或推荐。请阅读使用条款了解更多信息。