OPEN-SOURCE SCRIPT
Prometheus Stochastic
The Stochastic indicator is a popular indicator developed in the 1950s. It is designed to identify overbought and oversold scenarios on different assets. A value above 80 is considered overbought and a value below 20 is considered oversold.
The formula is as follows:
%k = ((Close - Low_i) / (High_i / Low_i)) * 100
Low_i and High_i represent the lowest low and highest high of the selected period.
The Prometheus version takes a slightly different approach:
%k = ((High - Lowest_Close_i) / (High_i / Low_i)) * 100
Using the Current High minus the Lowest Close provides us with a more robust range that can be slightly more sensitive to moves and provide a different perspective.
Code:
Pine Script®
This is the function that returns our Stochastic indicator.
What period do we use for the calculation? Let Prometheus handle that, we utilize a Sum of Squared Error calculation to find what lookback values can be most useful for a trader. How we do it is we calculate a Simple Moving Average or SMA and the indicator using a lot of different bars back values. Then if there is an event, characterized by the indicator crossing above 80 or below 20, we subtract the close by the SMA and square it. If there is no event we return a big value, we want the error to be as small as possible. Because we loop over every value for bars back, we get the value with the smallest error. We also do this for the smoothing values.
Pine Script®
This is the section where the best lookback values are calculated.
We provide the option to use this self optimizer or to use your own lookback values.

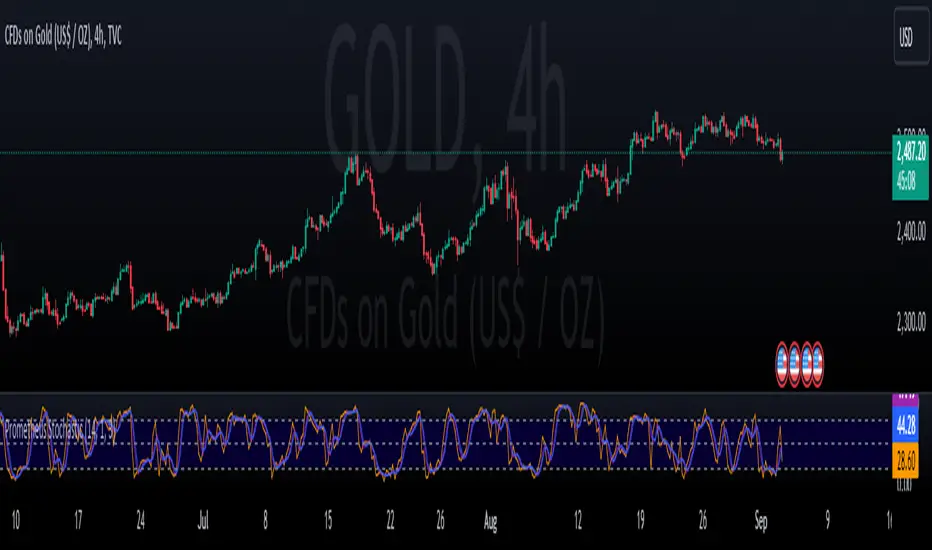
Here is an example on the daily SPY chart. The top Stochastic is the value with the SSE calculation, the bottom is with a fixed 14, 1, 3 input values. We see in the candles with boxes where some potential differences and trades may be.

This is another comparison of the SSE functionality and the fixed lookbacks on the $NYSE:PLTR 1 day chart.

Differences may be more apparent on lower time frame charts.
We encourage traders to not follow indicators blindly, none are 100% accurate. SSE does not guarantee that the values generated will be the best for a given moment in time. Please comment on any desired updates, all criticism is welcome!
The formula is as follows:
%k = ((Close - Low_i) / (High_i / Low_i)) * 100
Low_i and High_i represent the lowest low and highest high of the selected period.
The Prometheus version takes a slightly different approach:
%k = ((High - Lowest_Close_i) / (High_i / Low_i)) * 100
Using the Current High minus the Lowest Close provides us with a more robust range that can be slightly more sensitive to moves and provide a different perspective.
Code:
stoch_func(src_close, src_high, src_low, length) =>
100 * (src_high - ta.lowest(src_close, length)) / (ta.highest(src_high, length) - ta.lowest(src_low, length))
This is the function that returns our Stochastic indicator.
What period do we use for the calculation? Let Prometheus handle that, we utilize a Sum of Squared Error calculation to find what lookback values can be most useful for a trader. How we do it is we calculate a Simple Moving Average or SMA and the indicator using a lot of different bars back values. Then if there is an event, characterized by the indicator crossing above 80 or below 20, we subtract the close by the SMA and square it. If there is no event we return a big value, we want the error to be as small as possible. Because we loop over every value for bars back, we get the value with the smallest error. We also do this for the smoothing values.
// Function to calculate SSE for a given combination of N, K, and D
sse_calc(_N, _K, _D) =>
SMA = ta.sma(close, _N)
sf = stoch_func(close, high, low, _N)
k = ta.sma(sf, _K)
d = ta.sma(k, _D)
var float error = na
if ta.crossover(d, 80) or ta.crossunder(d, 20)
error := math.pow(close - SMA, 2)
else
error := 999999999999999999999999999999999999999
error
var int best_N = na
var int best_K = na
var int best_D = na
var float min_SSE = na
// Loop through all combinations of N, K, and D
for N in N_range
for K in K_range
for D in D_range
sse = sse_calc(N, K, D)
if (na(min_SSE) or sse < min_SSE)
min_SSE := sse
best_N := N
best_K := K
best_D := D
int N_opt = na
int K_opt = na
int D_opt = na
if c_lkb_bool == false
N_opt := best_N
K_opt := best_K
D_opt := best_D
This is the section where the best lookback values are calculated.
We provide the option to use this self optimizer or to use your own lookback values.
Here is an example on the daily
This is another comparison of the SSE functionality and the fixed lookbacks on the $NYSE:PLTR 1 day chart.
Differences may be more apparent on lower time frame charts.
We encourage traders to not follow indicators blindly, none are 100% accurate. SSE does not guarantee that the values generated will be the best for a given moment in time. Please comment on any desired updates, all criticism is welcome!
开源脚本
秉承TradingView的精神,该脚本的作者将其开源,以便交易者可以查看和验证其功能。向作者致敬!您可以免费使用该脚本,但请记住,重新发布代码须遵守我们的网站规则。
免责声明
这些信息和出版物并非旨在提供,也不构成TradingView提供或认可的任何形式的财务、投资、交易或其他类型的建议或推荐。请阅读使用条款了解更多信息。
开源脚本
秉承TradingView的精神,该脚本的作者将其开源,以便交易者可以查看和验证其功能。向作者致敬!您可以免费使用该脚本,但请记住,重新发布代码须遵守我们的网站规则。
免责声明
这些信息和出版物并非旨在提供,也不构成TradingView提供或认可的任何形式的财务、投资、交易或其他类型的建议或推荐。请阅读使用条款了解更多信息。