OPEN-SOURCE SCRIPT
Crypto Breadth | AlphaNatt

\Crypto Breadth | AlphaNatt\
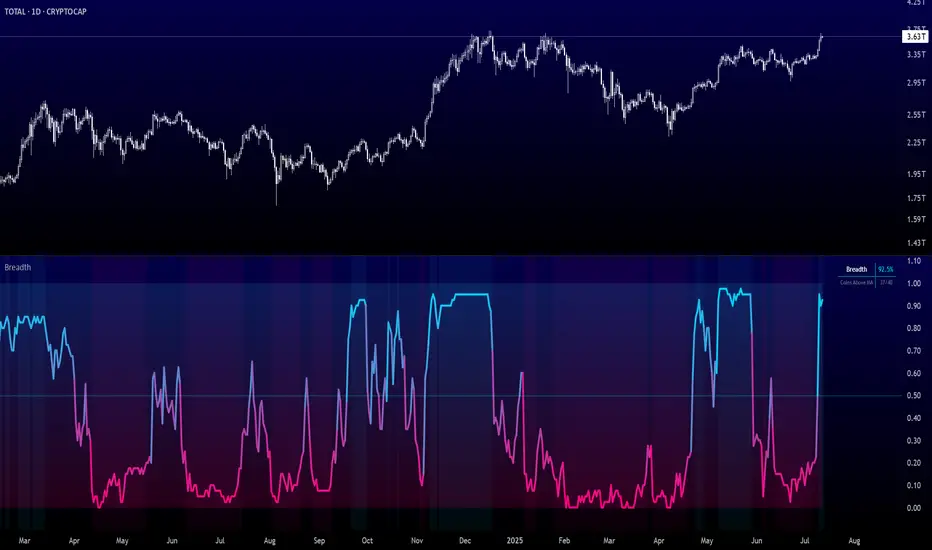
A dynamic, visually modern market breadth indicator designed to track the strength of the top 40 cryptocurrencies by measuring how many are trading above their respective 50-day moving averages. Built with precision, branding consistency, and UI enhancements for fast interpretation.
\📊 What This Script Does\
* Aggregates the performance of \40 major cryptocurrencies\ on Binance
* Calculates a \breadth score (0.00–1.00)\ based on how many tokens are above their moving averages
* Smooths the breadth with optional averaging
* Displays the result as a \dynamic, color-coded line\ with aesthetic glow and gradient fill
* Provides automatic \background zones\ for extreme bullish/bearish conditions
* Includes \alerts\ for key threshold crossovers
* Highlights current values in an \information panel\
\🧠 How It Works\
* Pulls real-time `close` prices for 40 coins (e.g., XRP, BNB, SOL, DOGE, PEPE, RENDER, etc.)
* Compares each coin's price to its 50-day SMA (adjustable)
* Assigns a binary score:
• 1 if the coin is above its MA
• 0 if it’s below
* Aggregates all results and divides by 40 to produce a normalized \breadth percentage\
\🎨 Visual Design Features\
* Smooth blue-to-pink \color gradient\ matching the AlphaNatt brand
* Soft \glow effects\ on the main line for enhanced legibility
* Beautiful \multi-stop fill gradient\ with 16 transition zones
* Optional \background shading\ when extreme sentiment is detected:
• Bullish zone if breadth > 80%
• Bearish zone if breadth < 20%
\⚙️ User Inputs\
* \Moving Average Length\ – Number of periods to calculate each coin’s SMA
* \Smoothing Length\ – Smooths the final breadth value
* \Show Background Zones\ – Toggle extreme sentiment overlays
* \Show Gradient Fill\ – Toggle the modern multicolor area fill
\🛠️ Utility Table (Top Right)\
* Displays live breadth percentage
* Shows how many coins (e.g., 27/40) are currently above their MA
\🔔 Alerts Included\
* \Breadth crosses above 50%\ → Bullish signal
* \Breadth crosses below 50%\ → Bearish signal
* \Breadth > 80%\ → Strong bullish trend
* \Breadth < 20%\ → Strong bearish trend
\📈 Best Used For\
* Gauging overall market strength or weakness
* Timing trend transitions in the crypto market
* Confirming trend-based strategies with broad market support
* Visual dashboard in macro dashboards or strategy overlays
\✅ Designed For\
* Swing traders
* Quantitative investors
* Market structure analysts
* Anyone seeking a macro view of crypto performance
Note: Not financial advise
开源脚本
秉承TradingView的精神,该脚本的作者将其开源,以便交易者可以查看和验证其功能。向作者致敬!您可以免费使用该脚本,但请记住,重新发布代码须遵守我们的网站规则。
Free Analysis Platform 👉 alphanatt.com
免责声明
这些信息和出版物并非旨在提供,也不构成TradingView提供或认可的任何形式的财务、投资、交易或其他类型的建议或推荐。请阅读使用条款了解更多信息。
开源脚本
秉承TradingView的精神,该脚本的作者将其开源,以便交易者可以查看和验证其功能。向作者致敬!您可以免费使用该脚本,但请记住,重新发布代码须遵守我们的网站规则。
Free Analysis Platform 👉 alphanatt.com
免责声明
这些信息和出版物并非旨在提供,也不构成TradingView提供或认可的任何形式的财务、投资、交易或其他类型的建议或推荐。请阅读使用条款了解更多信息。