OPEN-SOURCE SCRIPT
已更新 Table rsi multiframes(by Lc_M)
- Simultaneous display of RSI values on cells corresponding to each selected timeframe, organized in an intuitive table, adjustable in size and position.
- Color indicator on each cell that presents RSI values within the overbought and oversold levels. example: if the user wants to set the O.S/O.B levels to 20 - 80, the colored cells will only appear at "RSI" => 80 and "RSI" <= 20.
- Free configuration of graphic times, lengths and O.B/O.S, according to user standards
版本注释
Bug fix版本注释
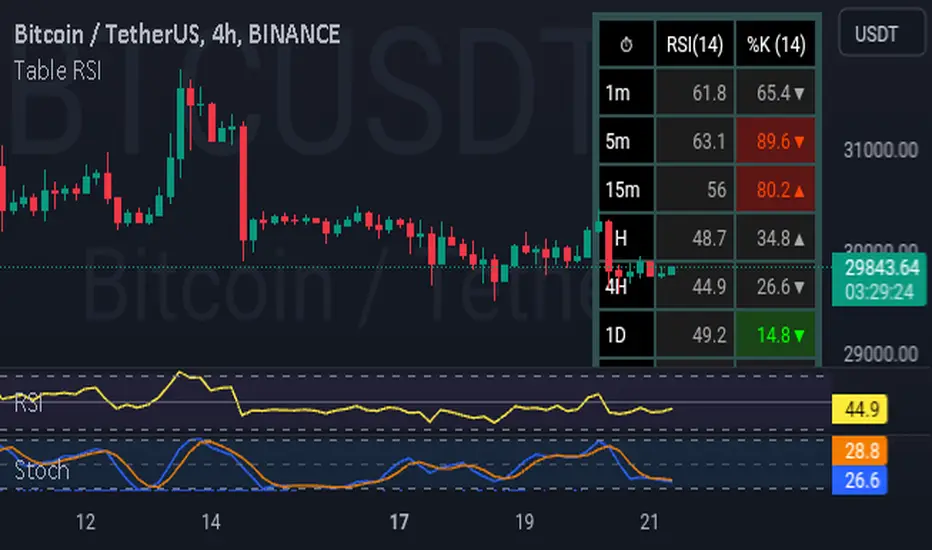
This table groups together a set of values referring to the RSI of each selected timeframe so that the user can follow them simultaneously.And to serve users who seek a more refined analysis, especially in the short term, a new column was implemented in this upgrade, containing the values of the stochastic indicator.
Check the Feat:
► Table with size and position adjustment, and selection of up to 7 different timeframes.
► COLUMN RSI: displays the values corresponding to each TF, allowing the user to adjust the length and font.
► COLOR INDICATOR ABOUT THE CELL: as the RSI reaches overbought/oversold levels, the cells tend to change their colors to red (RSI >= O.B) or green (RSI <= O.S), whatever the chart period.
((NOTE)): The O.B/O.S standards can be modified by the user, the color indicator automatically adapts to the established standards.
UPDATES:
•►► ENABLE/DISABLE TIMEFRAME: allows the user to keep a smaller amount of TF to be displayed in the table, as desired.
•►► STOCHASTIC OSCILLATOR : column with stochastic oscillator values for short-term analysis, with adjustments for %K Length, %K Smooth and %D values.
•►► COLOR INDICATOR ABOUT CELL: The functionality applied to RSI values is also applicable to stochastic values. It is worth mentioning that the adjustments of one do not interfere with the other, each one is individually adjustable.
•►► DIRECTIONAL ARROW: applicable only to the Stochastic column, this function informs the user when the value of line %K is above or below the value of line %D.
开源脚本
秉承TradingView的精神,该脚本的作者将其开源,以便交易者可以查看和验证其功能。向作者致敬!您可以免费使用该脚本,但请记住,重新发布代码须遵守我们的网站规则。
免责声明
这些信息和出版物并非旨在提供,也不构成TradingView提供或认可的任何形式的财务、投资、交易或其他类型的建议或推荐。请阅读使用条款了解更多信息。
免责声明
这些信息和出版物并非旨在提供,也不构成TradingView提供或认可的任何形式的财务、投资、交易或其他类型的建议或推荐。请阅读使用条款了解更多信息。