OPEN-SOURCE SCRIPT
已更新 Blockunity Drawdown Visualizer (BDV)
Monitor the drawdown (value of the drop between the highest and lowest points) of assets and act accordingly to reduce your risk.
Introducing BDV, the incredibly intuitive metric that visualizes asset drawdowns in the most visually appealing manner. With its color gradient display, BDV allows you to instantly grasp the state of retracement from the asset’s highest price level. But that’s not all – you have the option to display the oscillator’s colorization directly on your chart, enhancing your analysis even further.
The Idea
The goal is to provide the community with the best and most complete tool for visualizing the Drawdown of any asset.
How to Use
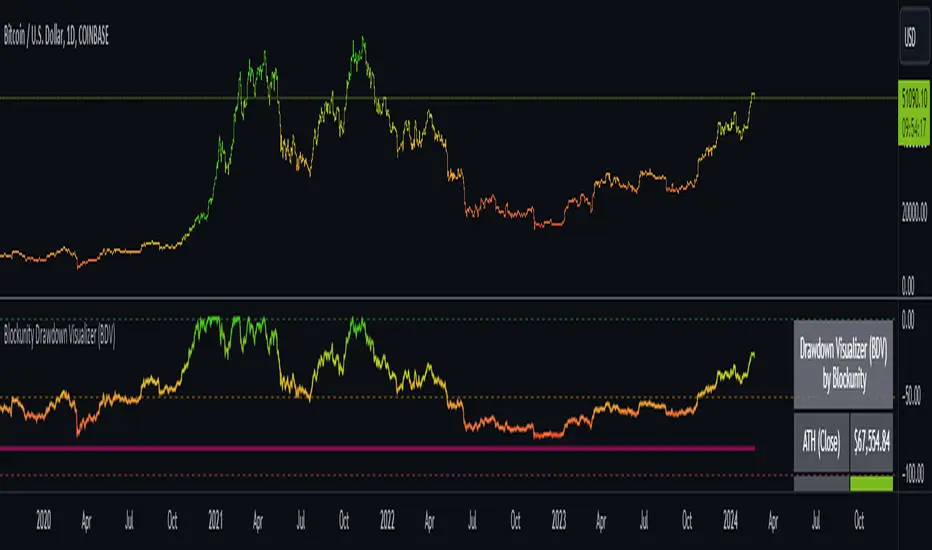
Very simple to use, the indicator takes the form of an oscillator, with colors ranging from red to green depending on the Drawdown level. A table summarizes several key data points.
Elements
On the oscillator, you'll find a line with a color gradient showing the asset's Drawdown. The flatter line represents the Max Drawdown (the lowest value reached).
In addition, the table summarizes several data:
Settings
First of all, you can activate a "Bar Color" in the settings (You must also uncheck "Borders" and "Wick" in your Chart Settings):

You can display Fibonacci levels on the oscillator. You'll see that levels can be relevant to drawdown. The color of the levels is also configurable.

In the calculation parameters, you can first choose between taking the High of the candles or the Close. By default this is Close, but if you change the parameter to High, the indication next to ATH in the table will change, and you'll see that the values in the table will be affected.

The second calculation parameter (Start Date) lets you modify the effective start date of the ATH, which will affect the drawdown level. Here's an example:

How it Works
First, we calculate the ATH:
Pine Script®
Then the drawdown is calculated as follows:
Pine Script®
Then the max drawdown :
Pine Script®
Introducing BDV, the incredibly intuitive metric that visualizes asset drawdowns in the most visually appealing manner. With its color gradient display, BDV allows you to instantly grasp the state of retracement from the asset’s highest price level. But that’s not all – you have the option to display the oscillator’s colorization directly on your chart, enhancing your analysis even further.
The Idea
The goal is to provide the community with the best and most complete tool for visualizing the Drawdown of any asset.
How to Use
Very simple to use, the indicator takes the form of an oscillator, with colors ranging from red to green depending on the Drawdown level. A table summarizes several key data points.
Elements
On the oscillator, you'll find a line with a color gradient showing the asset's Drawdown. The flatter line represents the Max Drawdown (the lowest value reached).
In addition, the table summarizes several data:
- The asset's All Time High (ATH).
- Current Drawdown.
- The Max Drawdown that has been reached.
Settings
First of all, you can activate a "Bar Color" in the settings (You must also uncheck "Borders" and "Wick" in your Chart Settings):
You can display Fibonacci levels on the oscillator. You'll see that levels can be relevant to drawdown. The color of the levels is also configurable.
In the calculation parameters, you can first choose between taking the High of the candles or the Close. By default this is Close, but if you change the parameter to High, the indication next to ATH in the table will change, and you'll see that the values in the table will be affected.
The second calculation parameter (Start Date) lets you modify the effective start date of the ATH, which will affect the drawdown level. Here's an example:
How it Works
First, we calculate the ATH:
var bdv_top = bdv_source
bdv_top := na(bdv_top[1]) ? bdv_source : math.max(bdv_source, bdv_top[1])
Then the drawdown is calculated as follows:
bdv = ((bdv_source / bdv_top) * 100) - 100
Then the max drawdown :
bdv_max = bdv
bdv_max := na(bdv_max[1]) ? bdv : math.min(bdv, bdv_max[1])
版本注释
Addition of an alerting system. This alert can be activated by setting the condition "Blockunity Drawdown Visualizer (BDV)" and selecting "Any alert() function call". The alerts sent are as follows:- New Max Drawdown.
- Drawdown falls below -25% / Drawdown recovers -25%.
- Drawdown falls below -50% / Drawdown recovers -50%.
- Drawdown falls below -75% / Drawdown recovers -75%.
开源脚本
秉承TradingView的精神,该脚本的作者将其开源,以便交易者可以查看和验证其功能。向作者致敬!您可以免费使用该脚本,但请记住,重新发布代码须遵守我们的网站规则。
Blockunity
app.blockunity.io/
unyx-data.com/
contact@blockunity.io
app.blockunity.io/
unyx-data.com/
contact@blockunity.io
免责声明
这些信息和出版物并非旨在提供,也不构成TradingView提供或认可的任何形式的财务、投资、交易或其他类型的建议或推荐。请阅读使用条款了解更多信息。
开源脚本
秉承TradingView的精神,该脚本的作者将其开源,以便交易者可以查看和验证其功能。向作者致敬!您可以免费使用该脚本,但请记住,重新发布代码须遵守我们的网站规则。
Blockunity
app.blockunity.io/
unyx-data.com/
contact@blockunity.io
app.blockunity.io/
unyx-data.com/
contact@blockunity.io
免责声明
这些信息和出版物并非旨在提供,也不构成TradingView提供或认可的任何形式的财务、投资、交易或其他类型的建议或推荐。请阅读使用条款了解更多信息。