OPEN-SOURCE SCRIPT
已更新 EMA 200 Price Deviation Alerts (1H Only)
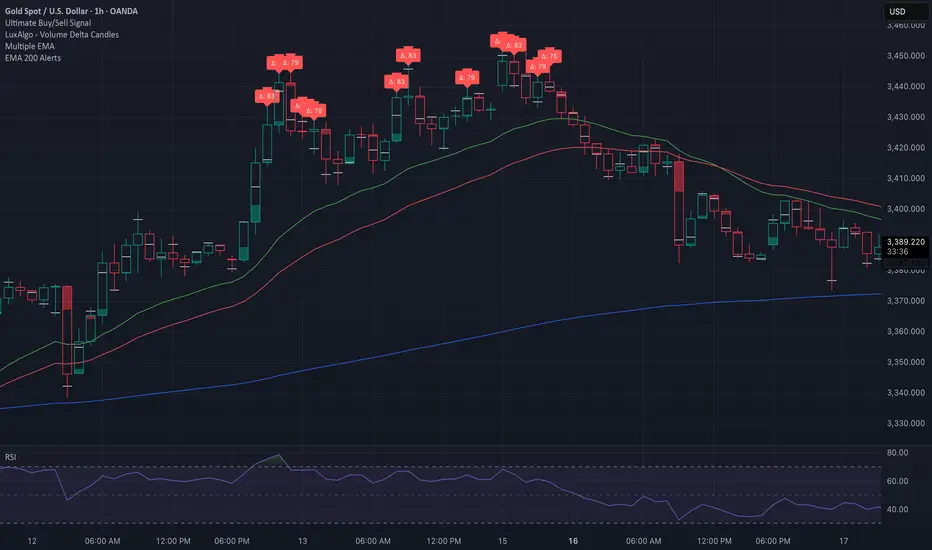
This script monitors the price deviation from the 200-period Exponential Moving Average (EMA) exclusively on the 1-hour chart. It generates alerts when the absolute difference between the current price and the EMA 200 exceeds a user-defined threshold (default: 65).
Features:
Works only on 1-hour (60-minute) charts to avoid false signals on other timeframes.
Customizable deviation threshold via script input.
Visual display of the 200 EMA on the chart.
Alert system to notify when price deviates significantly above or below the EMA.
Buy/Sell arrows shown when conditions are met:
Sell arrow appears when price is above the EMA and deviation exceeds threshold.
Buy arrow appears when price is below the EMA and deviation exceeds threshold.
Use this tool to identify potential overextended price moves relative to long-term trend support or resistance on the 1H timeframe.
版本注释
updated shows difference on 1 HR chart
版本注释
updated bars to show deviation on 1 hr chart版本注释
updated option to select deselect buy/sell signal label开源脚本
秉承TradingView的精神,该脚本的作者将其开源,以便交易者可以查看和验证其功能。向作者致敬!您可以免费使用该脚本,但请记住,重新发布代码须遵守我们的网站规则。
免责声明
这些信息和出版物并非旨在提供,也不构成TradingView提供或认可的任何形式的财务、投资、交易或其他类型的建议或推荐。请阅读使用条款了解更多信息。
开源脚本
秉承TradingView的精神,该脚本的作者将其开源,以便交易者可以查看和验证其功能。向作者致敬!您可以免费使用该脚本,但请记住,重新发布代码须遵守我们的网站规则。
免责声明
这些信息和出版物并非旨在提供,也不构成TradingView提供或认可的任何形式的财务、投资、交易或其他类型的建议或推荐。请阅读使用条款了解更多信息。