OPEN-SOURCE SCRIPT
Range Action Verification Index (RAVI) Strategy
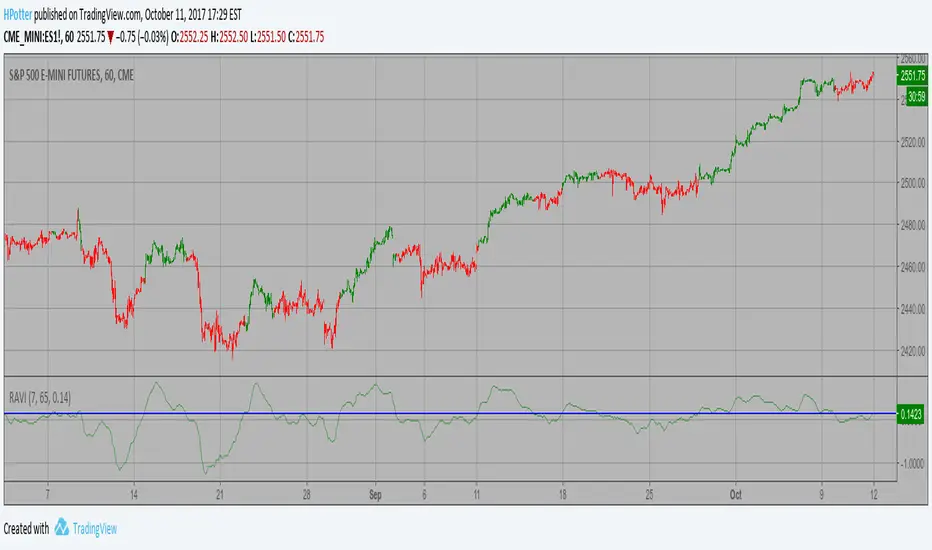
The indicator represents the relative convergence/divergence of the moving
averages of the financial asset, increased a hundred times. It is based on
a different principle than the ADX. Chande suggests a 13-week SMA as the
basis for the indicator. It represents the quarterly (3 months = 65 working days)
sentiments of the market participants concerning prices. The short moving average
comprises 10% of the one and is rounded to seven.
WARNING:
- This script to change bars colors.
开源脚本
秉承TradingView的精神,该脚本的作者将其开源,以便交易者可以查看和验证其功能。向作者致敬!您可以免费使用该脚本,但请记住,重新发布代码须遵守我们的网站规则。
免责声明
这些信息和出版物并非旨在提供,也不构成TradingView提供或认可的任何形式的财务、投资、交易或其他类型的建议或推荐。请阅读使用条款了解更多信息。
开源脚本
秉承TradingView的精神,该脚本的作者将其开源,以便交易者可以查看和验证其功能。向作者致敬!您可以免费使用该脚本,但请记住,重新发布代码须遵守我们的网站规则。
免责声明
这些信息和出版物并非旨在提供,也不构成TradingView提供或认可的任何形式的财务、投资、交易或其他类型的建议或推荐。请阅读使用条款了解更多信息。