OPEN-SOURCE SCRIPT
已更新 Composite RSI
One issue with the famouse RSI indicator is that it is too sensitive in some cases and thus, might give false signals if we are eager to use those signals.
If we increase the length of the RSI, it might give too few signals which is not ideal as well.
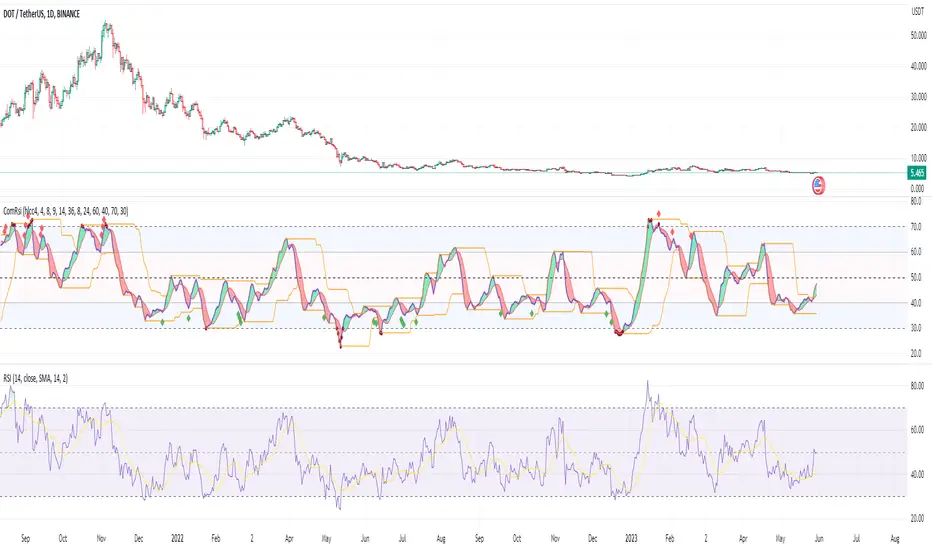
This Composite RSI indicator was created to utilize the RSI strength, using 3 RSIs (with different length) in combination to give less signal than the original one.
You can use it like a normal RSI indicator:
- Try to find the entry when the RSI is in the overbought (RSI >= 70) and oversold (RSI <= 30) areas
- Use bullish divergence and bearish divergence on the RSI itself to signal your trade
In the example chart, I included a built-in RSI as well so you that you can compare the original one and the Composite RSI indicator.
Some extra features:
- Simple bullish and bearish divergences detection.
- Mark the RSI with green circle(s) when it is extremely overbought (over 80) and oversold (under 20)
If we increase the length of the RSI, it might give too few signals which is not ideal as well.
This Composite RSI indicator was created to utilize the RSI strength, using 3 RSIs (with different length) in combination to give less signal than the original one.
You can use it like a normal RSI indicator:
- Try to find the entry when the RSI is in the overbought (RSI >= 70) and oversold (RSI <= 30) areas
- Use bullish divergence and bearish divergence on the RSI itself to signal your trade
In the example chart, I included a built-in RSI as well so you that you can compare the original one and the Composite RSI indicator.
Some extra features:
- Simple bullish and bearish divergences detection.
- Mark the RSI with green circle(s) when it is extremely overbought (over 80) and oversold (under 20)
版本注释
Update chart.开源脚本
秉承TradingView的精神,该脚本的作者将其开源,以便交易者可以查看和验证其功能。向作者致敬!您可以免费使用该脚本,但请记住,重新发布代码须遵守我们的网站规则。
免责声明
这些信息和出版物并非旨在提供,也不构成TradingView提供或认可的任何形式的财务、投资、交易或其他类型的建议或推荐。请阅读使用条款了解更多信息。
开源脚本
秉承TradingView的精神,该脚本的作者将其开源,以便交易者可以查看和验证其功能。向作者致敬!您可以免费使用该脚本,但请记住,重新发布代码须遵守我们的网站规则。
免责声明
这些信息和出版物并非旨在提供,也不构成TradingView提供或认可的任何形式的财务、投资、交易或其他类型的建议或推荐。请阅读使用条款了解更多信息。