OPEN-SOURCE SCRIPT
已更新 Moving Average Crossover Histogram Indicator
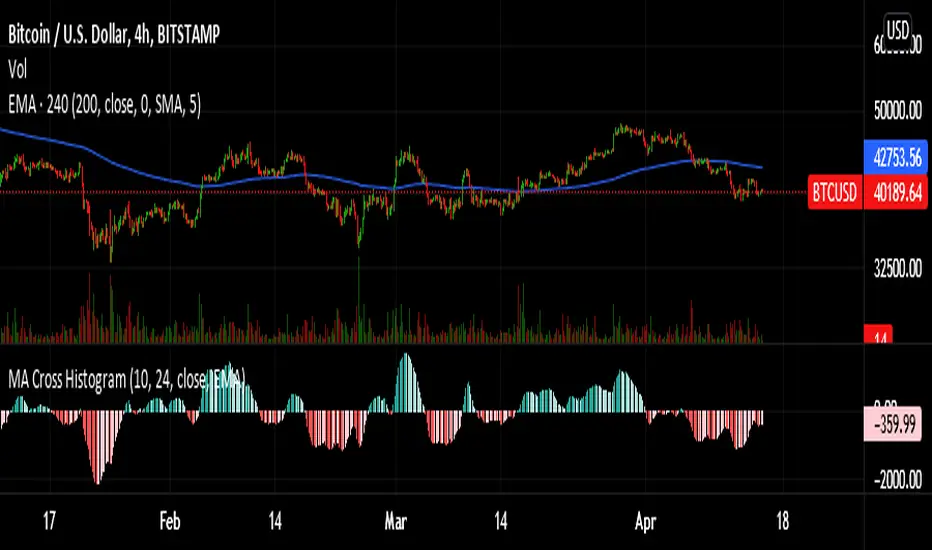
A modified version of the MACD indicator. As its name suggests, this is a moving average crossover indicator but the difference in values between moving averages is represented by a histogram. It subtracts the value of a fast MA and slow MA then the result is represented in a histogram which makes it easier for you to identify and visualize every moving average crossover.
If you use moving average crossover as your buy/sell signal this indicator is for you.
You could use this indicator instead of using two moving averages on your main chart. Really convenient, easy to use, and make your chart clutter-free. You could set the fast and slow MA values also the moving average types according to your trading style.
Hope you like it. :)
版本注释
Added and edited some line of code so that both of the moving average mode can be changed independently.开源脚本
秉承TradingView的精神,该脚本的作者将其开源,以便交易者可以查看和验证其功能。向作者致敬!您可以免费使用该脚本,但请记住,重新发布代码须遵守我们的网站规则。
免责声明
这些信息和出版物并非旨在提供,也不构成TradingView提供或认可的任何形式的财务、投资、交易或其他类型的建议或推荐。请阅读使用条款了解更多信息。
开源脚本
秉承TradingView的精神,该脚本的作者将其开源,以便交易者可以查看和验证其功能。向作者致敬!您可以免费使用该脚本,但请记住,重新发布代码须遵守我们的网站规则。
免责声明
这些信息和出版物并非旨在提供,也不构成TradingView提供或认可的任何形式的财务、投资、交易或其他类型的建议或推荐。请阅读使用条款了解更多信息。