PROTECTED SOURCE SCRIPT
Wüsten
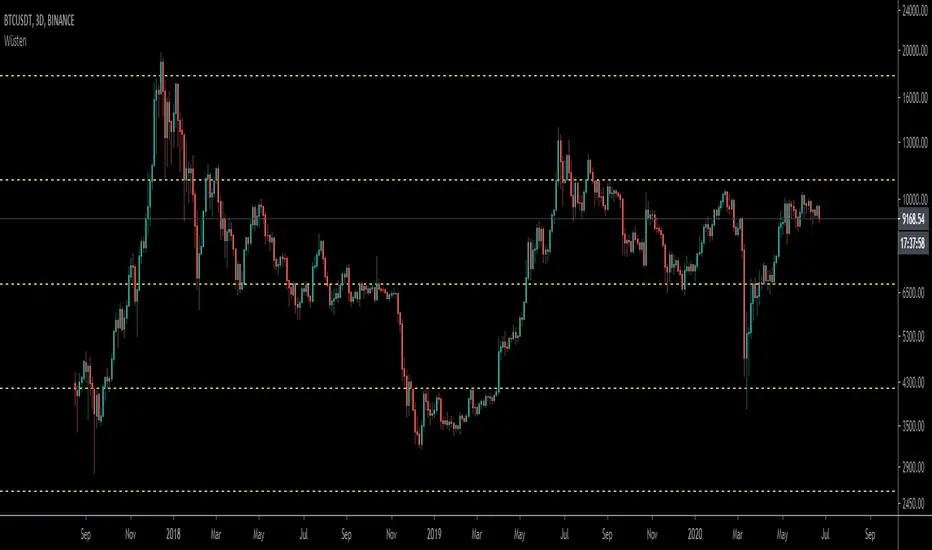
Plots Fibonacci Levels Automatically
Instruction to add it:
1) Click Below Right button: ADD TO FAVORITE SCRIPTS.
2) On your chart, click Indicators, search for Wusten
3) Once added on left go to settings.... Leave INPUT tab, click STYLE tab.
4) UN-TICK ALL PLOT boxes.
5) Scroll all the way down and at the very bottom left click DEFAULTS, and click SAVE AS DEFAULT.
(if you DON'T un-tick all PLOT boxes it draws another line on top of the dashed line for some reason).
6) The color should be as close to the one you wanted.
If not take time and correct the colors on the STYLE tab BUT remember to always go and click SAVE AS DEFAULT when done.
Then your colors will always stay like that.
受保护脚本
此脚本以闭源形式发布。 但是,您可以自由使用,没有任何限制 — 了解更多信息这里。
免责声明
这些信息和出版物并非旨在提供,也不构成TradingView提供或认可的任何形式的财务、投资、交易或其他类型的建议或推荐。请阅读使用条款了解更多信息。
免责声明
这些信息和出版物并非旨在提供,也不构成TradingView提供或认可的任何形式的财务、投资、交易或其他类型的建议或推荐。请阅读使用条款了解更多信息。