PROTECTED SOURCE SCRIPT
已更新 YUSUF LOG 1.deneme
This indicator integrates multiple data points and uses them together to generate auxiliary buy or sell signals. It relies on volume, overbought/oversold signals, and moving averages. It should not be used alone but rather as part of a broader strategy to aid in decision-making.
版本注释
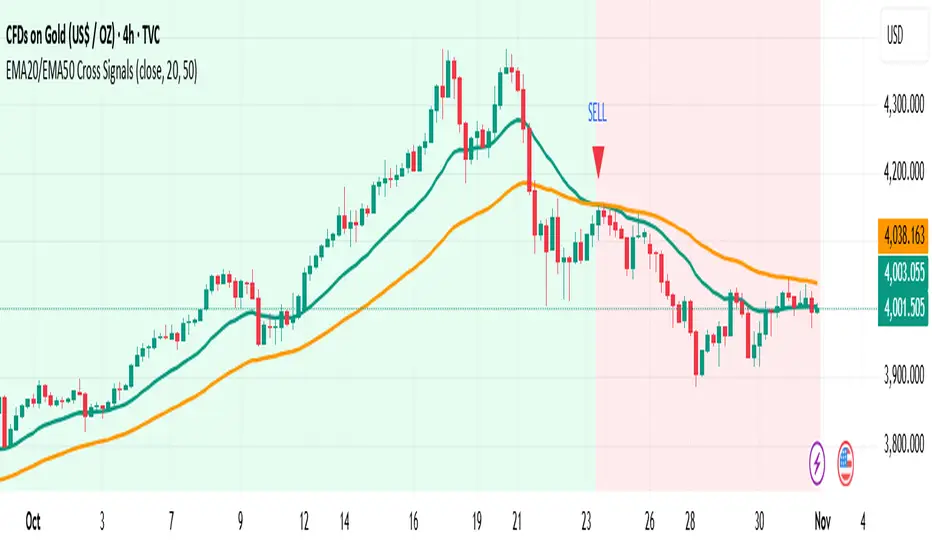
What it doesGenerates BUY and SELL signals when the EMA 20 crosses the EMA 50. It plots both EMAs, paints background by trend, and can trigger TradingView alerts.
How it works
BUY: when EMA20 crosses above EMA50.
SELL: when EMA20 crosses below EMA50.
Optional confirmation requires the candle close to be above/below both EMAs to reduce whipsaws.
Inputs
Source: price source (default: close).
Fast EMA / Slow EMA: default 20 / 50, fully adjustable.
Require close confirm: on/off filter for stronger signals.
Color background by trend: visual trend context.
Visuals & Alerts
Plots EMA20 and EMA50.
Draws upward/downward triangles for Buy/Sell signals.
Two alert conditions: BUY (EMA20 x EMA50 Up) and SELL (EMA20 x EMA50 Down).
Best practices
Use higher timeframes (e.g., H1/H4) or enable confirmation to reduce noise.
Combine with support/resistance and volume for better entries and exits.
Consider ATR-based stops and partial take-profits around recent structure levels.
受保护脚本
此脚本以闭源形式发布。 但是,您可以自由使用,没有任何限制 — 了解更多信息这里。
免责声明
这些信息和出版物并非旨在提供,也不构成TradingView提供或认可的任何形式的财务、投资、交易或其他类型的建议或推荐。请阅读使用条款了解更多信息。
受保护脚本
此脚本以闭源形式发布。 但是,您可以自由使用,没有任何限制 — 了解更多信息这里。
免责声明
这些信息和出版物并非旨在提供,也不构成TradingView提供或认可的任何形式的财务、投资、交易或其他类型的建议或推荐。请阅读使用条款了解更多信息。