PROTECTED SOURCE SCRIPT
已更新 Fundamental Strategy - anuragmundra
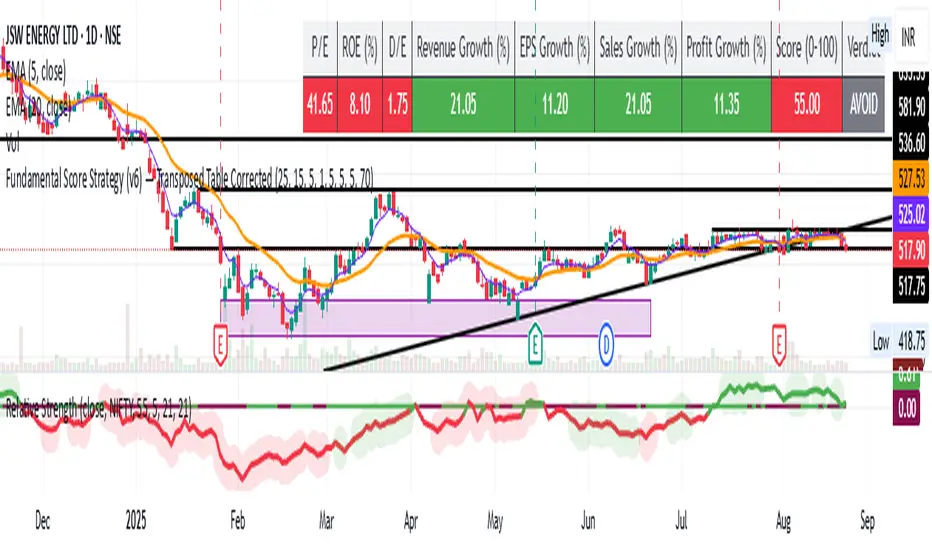
Fundamental Score Based Backtest
This strategy combines fundamental analysis with automated backtesting to help identify long-term investment opportunities. Instead of relying only on price action or technical indicators, it evaluates the financial health of a company and generates simulated BUY/SELL signals accordingly.
🔑 Key Parameters Considered:
Price-to-Earnings (P/E Ratio): Ensures the stock is not overpriced.
Return on Equity (ROE): Indicates efficiency of management and business profitability.
Debt-to-Equity Ratio (D/E): Evaluates leverage and financial risk.
Revenue Growth (YoY): Shows business expansion and demand.
EPS Growth: Reflects consistent profit generation for shareholders.
Sales Growth: Confirms topline improvement.
Profit Growth: Measures bottom-line strength.
✅ Buy Condition
When the fundamental score ≥ 70/100, the strategy enters a long position.
Score is based on meeting/exceeding thresholds for P/E, ROE, Revenue Growth, EPS Growth, Sales Growth, Profit Growth, and Debt-to-Equity.
❌ Sell/Exit Condition
When the score falls below 70, the position is closed.
⚡ How to Use
Designed for medium to long-term investors who prefer fundamentally strong companies.
Can be run in the Strategy Tester to evaluate the historical performance of any stock.
Suitable as a stock-picking filter rather than a short-term trading system.
📊 Notes
Some ratios (like ROE) are based on annual values (FY), while others (EPS, Revenue, Net Income) use TTM for recency.
Not all symbols/exchanges provide full fundamental data. If data is missing, some metrics may show as N/A.
⚠️ Disclaimer: This is an educational tool for research and backtesting only. It is not financial advice. Always combine with your own due diligence before making investment decisions.
版本注释
Updated Overlay = true版本注释
Updated the table data and direction版本注释
Updated table color and symbol read logic受保护脚本
此脚本以闭源形式发布。 但是,您可以自由使用,没有任何限制 — 了解更多信息这里。
免责声明
这些信息和出版物并非旨在提供,也不构成TradingView提供或认可的任何形式的财务、投资、交易或其他类型的建议或推荐。请阅读使用条款了解更多信息。
受保护脚本
此脚本以闭源形式发布。 但是,您可以自由使用,没有任何限制 — 了解更多信息这里。
免责声明
这些信息和出版物并非旨在提供,也不构成TradingView提供或认可的任何形式的财务、投资、交易或其他类型的建议或推荐。请阅读使用条款了解更多信息。