OPEN-SOURCE SCRIPT
EMA 20/50/100/200 [NT-DIGITALS]
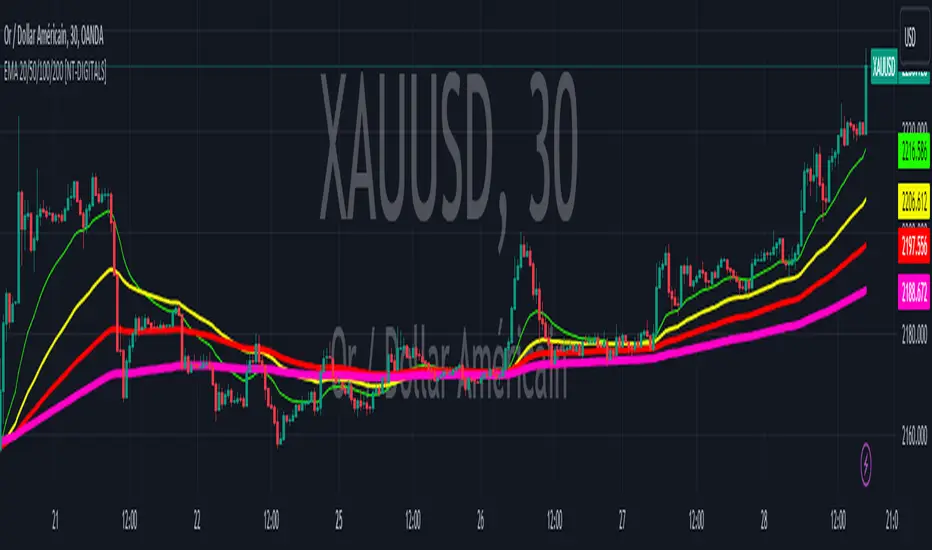
This script plots Exponential Moving Averages (EMA) of 20, 50, 100, and 200 periods on the chart. EMAs are commonly used by traders to identify trends and potential reversal points in the market. The EMA smooths out price data to create a single line that follows the overall trend more closely than a simple moving average. By plotting multiple EMAs of different periods, traders can observe the interaction between short-term and long-term trends, aiding in decision-making for entry and exit points.
Exponential Moving Average (EMA) is a type of moving average that gives more weight to recent price data, making it more responsive to current price movements compared to a simple moving average (SMA). The EMA is calculated by applying a smoothing factor to the previous EMA value and adding a fraction of the difference between the current price and the previous EMA value. This weighting mechanism results in EMAs reacting more quickly to price changes, making them popular for traders looking to capture short-term trends in the market.
Exponential Moving Average (EMA) is a type of moving average that gives more weight to recent price data, making it more responsive to current price movements compared to a simple moving average (SMA). The EMA is calculated by applying a smoothing factor to the previous EMA value and adding a fraction of the difference between the current price and the previous EMA value. This weighting mechanism results in EMAs reacting more quickly to price changes, making them popular for traders looking to capture short-term trends in the market.
开源脚本
秉承TradingView的精神,该脚本的作者将其开源,以便交易者可以查看和验证其功能。向作者致敬!您可以免费使用该脚本,但请记住,重新发布代码须遵守我们的网站规则。
免责声明
这些信息和出版物并非旨在提供,也不构成TradingView提供或认可的任何形式的财务、投资、交易或其他类型的建议或推荐。请阅读使用条款了解更多信息。
开源脚本
秉承TradingView的精神,该脚本的作者将其开源,以便交易者可以查看和验证其功能。向作者致敬!您可以免费使用该脚本,但请记住,重新发布代码须遵守我们的网站规则。
免责声明
这些信息和出版物并非旨在提供,也不构成TradingView提供或认可的任何形式的财务、投资、交易或其他类型的建议或推荐。请阅读使用条款了解更多信息。