OPEN-SOURCE SCRIPT
已更新 BE-EMA(12,26) (Blue Empire Exponential Moving Average)
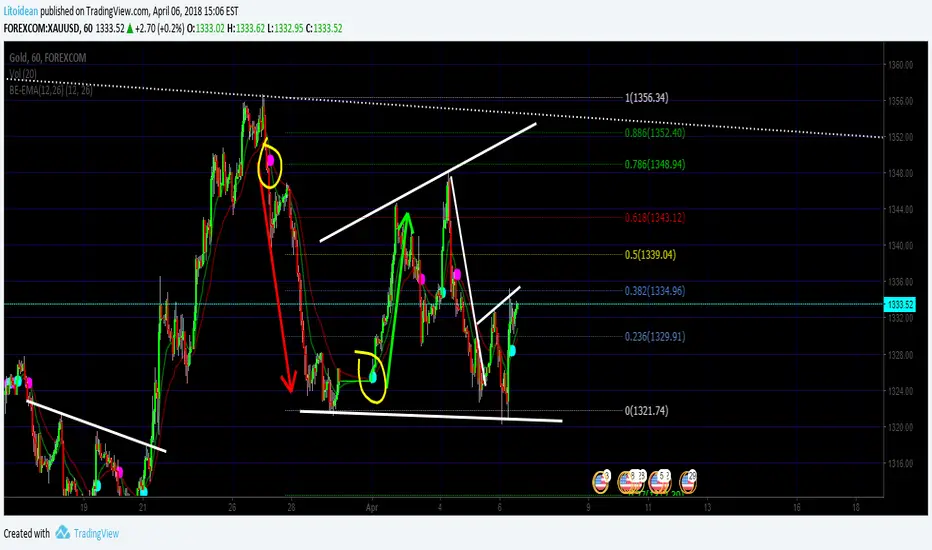
Simple EMA where you get a CROSS mark between EMA 12 and EMA 26.
Each time a cross happens, a spot gets created.
If it's cyan, it goes up.
If it's magenta, it goes down.
I'm studying Trading at Blue Empire Academy, if you want to know more send me a PM.
Wave Analysis study the wave's behavior and tries to predict by using trendlines, elliot waves, fibonacci retracements, and EMAs basically.
In this Indicator, It's a confirmation when EMA 12 goes over to confirm the price may go up. and Vice versa.
Hope you like, please share if you think it's useful and comment if you think this can be better.
Thank you again for reading
>> This is just an indicator, it doesn't predict the future. Use it at your own risk. <<
##########
All the credits to Tracks, a genius who helped me polish the code. :] thank you.
版本注释
Added - Extra 200 MA (Long-Period Indicator)开源脚本
秉承TradingView的精神,该脚本的作者将其开源,以便交易者可以查看和验证其功能。向作者致敬!您可以免费使用该脚本,但请记住,重新发布代码须遵守我们的网站规则。
免责声明
这些信息和出版物并非旨在提供,也不构成TradingView提供或认可的任何形式的财务、投资、交易或其他类型的建议或推荐。请阅读使用条款了解更多信息。
开源脚本
秉承TradingView的精神,该脚本的作者将其开源,以便交易者可以查看和验证其功能。向作者致敬!您可以免费使用该脚本,但请记住,重新发布代码须遵守我们的网站规则。
免责声明
这些信息和出版物并非旨在提供,也不构成TradingView提供或认可的任何形式的财务、投资、交易或其他类型的建议或推荐。请阅读使用条款了解更多信息。