PINE LIBRARY
MathStatisticsKernelDensityEstimation
Library "MathStatisticsKernelDensityEstimation"
(KDE) Method for Kernel Density Estimation
kde(observations, kernel, bandwidth, nsteps)
Parameters:
Returns: tuple with signature: (float array, float array)
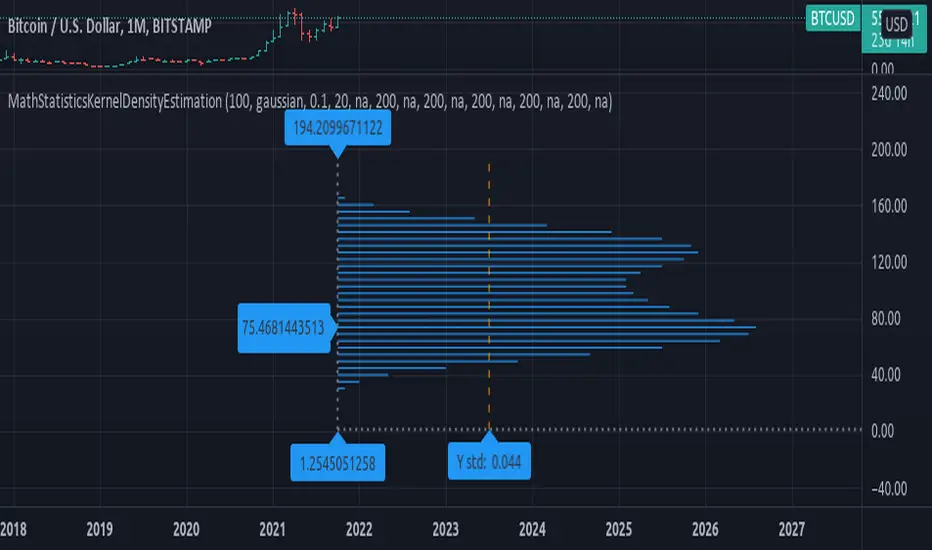
draw_horizontal(distribution_x, distribution_y, distribution_lines, graph_lines, graph_labels) Draw a horizontal distribution at current location on chart.
Parameters:
Returns: void, updates arrays: distribution_lines, graph_lines, graph_labels.
draw_vertical(distribution_x, distribution_y, distribution_lines, graph_lines, graph_labels) Draw a vertical distribution at current location on chart.
Parameters:
Returns: void, updates arrays: distribution_lines, graph_lines, graph_labels.
style_distribution(lines, horizontal, to_histogram, line_color, line_style, linewidth) Style the distribution lines.
Parameters:
Returns: void.
style_graph(lines, lines, horizontal, line_color, line_style, linewidth) Style the graph lines and labels
Parameters:
Returns: void.
(KDE) Method for Kernel Density Estimation
kde(observations, kernel, bandwidth, nsteps)
Parameters:
- observations: float array, sample data.
- kernel: string, the kernel to use, default='gaussian', options='uniform', 'triangle', 'epanechnikov', 'quartic', 'triweight', 'gaussian', 'cosine', 'logistic', 'sigmoid'.
- bandwidth: float, bandwidth to use in kernel, default=0.5, range=(0, +inf), less will smooth the data.
- nsteps: int, number of steps in range of distribution, default=20, this value is connected to how many line objects you can display per script.
Returns: tuple with signature: (float array, float array)
draw_horizontal(distribution_x, distribution_y, distribution_lines, graph_lines, graph_labels) Draw a horizontal distribution at current location on chart.
Parameters:
- distribution_x: float array, distribution points x value.
- distribution_y: float array, distribution points y value.
- distribution_lines: line array, array to append the distribution curve lines.
- graph_lines: line array, array to append the graph lines.
- graph_labels: label array, array to append the graph labels.
Returns: void, updates arrays: distribution_lines, graph_lines, graph_labels.
draw_vertical(distribution_x, distribution_y, distribution_lines, graph_lines, graph_labels) Draw a vertical distribution at current location on chart.
Parameters:
- distribution_x: float array, distribution points x value.
- distribution_y: float array, distribution points y value.
- distribution_lines: line array, array to append the distribution curve lines.
- graph_lines: line array, array to append the graph lines.
- graph_labels: label array, array to append the graph labels.
Returns: void, updates arrays: distribution_lines, graph_lines, graph_labels.
style_distribution(lines, horizontal, to_histogram, line_color, line_style, linewidth) Style the distribution lines.
Parameters:
- lines: line array, distribution lines to style.
- horizontal: bool, default=true, if the display is horizontal(true) or vertical(false).
- to_histogram: bool, default=false, if graph style should be switched to histogram.
- line_color: color, default=na, if defined will change the color of the lines.
- line_style: string, defaul=na, if defined will change the line style, options=('na', line.style_solid, line.style_dotted, line.style_dashed, line.style_arrow_right, line.style_arrow_left, line.style_arrow_both)
- linewidth: int, default=na, if defined will change the line width.
Returns: void.
style_graph(lines, lines, horizontal, line_color, line_style, linewidth) Style the graph lines and labels
Parameters:
- lines: line array, graph lines to style.
- lines: labels array, graph labels to style.
- horizontal: bool, default=true, if the display is horizontal(true) or vertical(false).
- line_color: color, default=na, if defined will change the color of the lines.
- line_style: string, defaul=na, if defined will change the line style, options=('na', line.style_solid, line.style_dotted, line.style_dashed, line.style_arrow_right, line.style_arrow_left, line.style_arrow_both)
- linewidth: int, default=na, if defined will change the line width.
Returns: void.
Pine脚本库
秉承TradingView的精神,作者已将此Pine代码作为开源库发布,以便我们社区的其他Pine程序员可以重用它。向作者致敬!您可以私下或在其他开源出版物中使用此库,但在出版物中重用此代码须遵守网站规则。
免责声明
这些信息和出版物并非旨在提供,也不构成TradingView提供或认可的任何形式的财务、投资、交易或其他类型的建议或推荐。请阅读使用条款了解更多信息。
Pine脚本库
秉承TradingView的精神,作者已将此Pine代码作为开源库发布,以便我们社区的其他Pine程序员可以重用它。向作者致敬!您可以私下或在其他开源出版物中使用此库,但在出版物中重用此代码须遵守网站规则。
免责声明
这些信息和出版物并非旨在提供,也不构成TradingView提供或认可的任何形式的财务、投资、交易或其他类型的建议或推荐。请阅读使用条款了解更多信息。