PROTECTED SOURCE SCRIPT
已更新 Market Strength
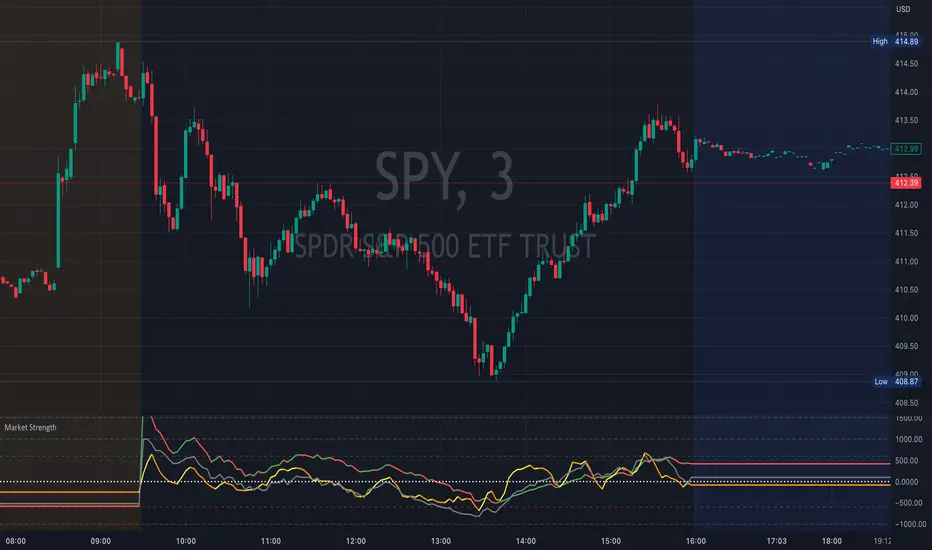
This indicator tracks  ADD, TICK, VVOLD on the chart while sharing the same space. This allows you to watch these important indicators without the need to give up separate dedicated space for each of them.
ADD is the number of NYSE stocks advancing vs declining
TICK is the number NYSE stocks trading on an uptick vs downtick
VVOLD is the NYSE Volume Difference and is the difference between the up volume and down volume
Zero is considered to be the pivot. The more positive the values, the more bullish in nature, while the more negative the values, the more bearish in nature.
When these are at an extreme, they indicate a possible market trend while smaller directional changes may foreshadow a market move in that direction.
If you like the indicator, please like and share!
Thank you!
版本注释
VOLD label fixed受保护脚本
此脚本以闭源形式发布。 但是,您可以自由使用,没有任何限制 — 了解更多信息这里。
免责声明
这些信息和出版物并非旨在提供,也不构成TradingView提供或认可的任何形式的财务、投资、交易或其他类型的建议或推荐。请阅读使用条款了解更多信息。
免责声明
这些信息和出版物并非旨在提供,也不构成TradingView提供或认可的任何形式的财务、投资、交易或其他类型的建议或推荐。请阅读使用条款了解更多信息。