OPEN-SOURCE SCRIPT
ZIP Entry Strategy( Using 50 SMA and 100 SMA)
Description:
This strategy uses only two simple moving averages, specifically the 50 SMA and the 100 SMA.
Simple moving average : A simple moving average (SMA) calculates the average of a selected range of prices, usually closing prices, by the number of periods in that range.
Here's how it works:
Background color:
The chart background is colored green when the price is above the 100 SMA.
The chart background turns red when the price is below the 100 SMA.
The greenback ground suggest the bullish momentum and the red background suggests the bearish momentum.
We can use this long term trend to take the trades in alignment with the trend to increase our odds.
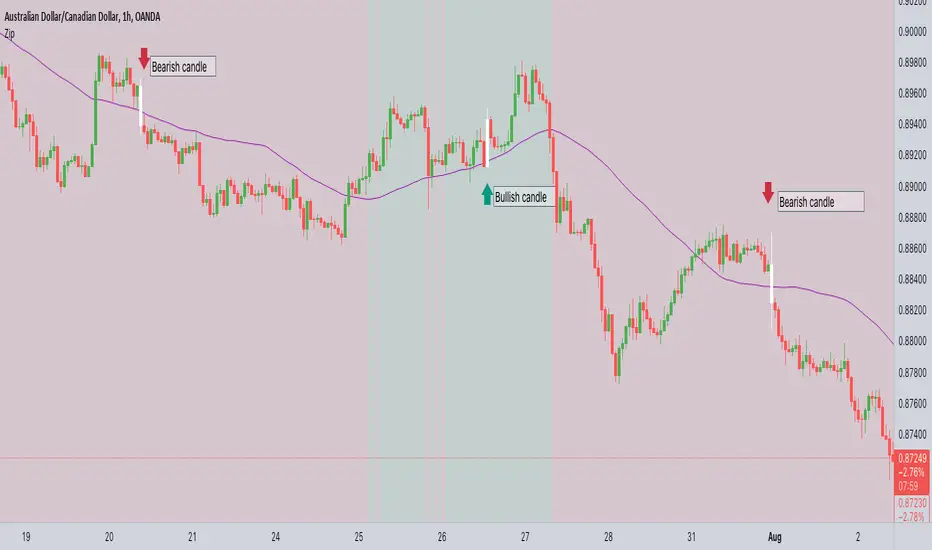
We will use the 50 SMA to identify the spots when a new trend is starting. When the price crosses above the 50 SMA while the background is green, the candle/bar color changes to white indicating a new trend beginning.
Conversely, when the price crosses below the 50 SMA while the background is red, the candle/bar color also changes to white indicating a new trend beginning.
The occurrence of white candles indicates the start of a potential new trend in alignment with the long term trend.
However, it's essential to remember that like any trading strategy, this one is not perfect. For more reliable results, it's advisable to combine it with a consideration of the overall price structure to minimize false entry signals.
Originality and usefulness
Even though it makes use of two moving averages, we don't use the moving average crossover. The moving average crossovers are either lagging or provide too many false signals. We have tried to address these issue with this strategy. While maintaining the long-term trend and ignoring false signals, it gives out signals early.
You can choose the moving average that best suits your needs by changing these moving averages to a different moving average . The 50 SMA and 100 SMA appeared to be giving the better signals in my experience.
I dont use any other indicators but i would like to check the price structure to make sure its moving along with the 50 SMA. Sometimes the choppy markets might give false signals.
Its okay to see multiple white candles as long as the price structure holds.
I have highlighted the white candles in the above chart. The color of the candle is always the same so the background decides whether its bearish or bullish cross
This strategy uses only two simple moving averages, specifically the 50 SMA and the 100 SMA.
Simple moving average : A simple moving average (SMA) calculates the average of a selected range of prices, usually closing prices, by the number of periods in that range.
Here's how it works:
Background color:
The chart background is colored green when the price is above the 100 SMA.
The chart background turns red when the price is below the 100 SMA.
The greenback ground suggest the bullish momentum and the red background suggests the bearish momentum.
We can use this long term trend to take the trades in alignment with the trend to increase our odds.
We will use the 50 SMA to identify the spots when a new trend is starting. When the price crosses above the 50 SMA while the background is green, the candle/bar color changes to white indicating a new trend beginning.
Conversely, when the price crosses below the 50 SMA while the background is red, the candle/bar color also changes to white indicating a new trend beginning.
The occurrence of white candles indicates the start of a potential new trend in alignment with the long term trend.
However, it's essential to remember that like any trading strategy, this one is not perfect. For more reliable results, it's advisable to combine it with a consideration of the overall price structure to minimize false entry signals.
Originality and usefulness
Even though it makes use of two moving averages, we don't use the moving average crossover. The moving average crossovers are either lagging or provide too many false signals. We have tried to address these issue with this strategy. While maintaining the long-term trend and ignoring false signals, it gives out signals early.
You can choose the moving average that best suits your needs by changing these moving averages to a different moving average . The 50 SMA and 100 SMA appeared to be giving the better signals in my experience.
I dont use any other indicators but i would like to check the price structure to make sure its moving along with the 50 SMA. Sometimes the choppy markets might give false signals.
Its okay to see multiple white candles as long as the price structure holds.
I have highlighted the white candles in the above chart. The color of the candle is always the same so the background decides whether its bearish or bullish cross
开源脚本
秉承TradingView的精神,该脚本的作者将其开源,以便交易者可以查看和验证其功能。向作者致敬!您可以免费使用该脚本,但请记住,重新发布代码须遵守我们的网站规则。
免责声明
这些信息和出版物并非旨在提供,也不构成TradingView提供或认可的任何形式的财务、投资、交易或其他类型的建议或推荐。请阅读使用条款了解更多信息。
开源脚本
秉承TradingView的精神,该脚本的作者将其开源,以便交易者可以查看和验证其功能。向作者致敬!您可以免费使用该脚本,但请记住,重新发布代码须遵守我们的网站规则。
免责声明
这些信息和出版物并非旨在提供,也不构成TradingView提供或认可的任何形式的财务、投资、交易或其他类型的建议或推荐。请阅读使用条款了解更多信息。