OPEN-SOURCE SCRIPT
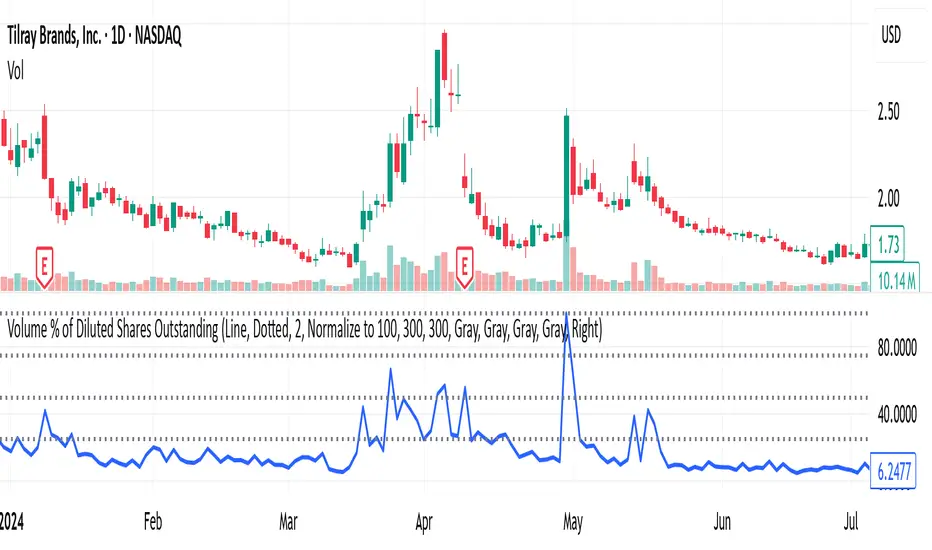
Volume % of Diluted Shares Outstanding

Indicator does what it says - shows the volume traded per time frame as percentage of shares outstanding.
There are three scaling modes, see below.
Absolute (0–100%+) → The line values are the true % of diluted shares traded.
If the plot is at 12, that means 12% of all diluted shares traded that day.
Auto-range (absolute) → The line values are still the true % of shares traded (the y-axis is in real percentages).
But the reference lines (25/50/75/100) are not literal percentages anymore; they are markers at fractions of the local min-to-max range.
So your blue bars are real (e.g., 12% really is 12%), but the dotted lines are relative.
Normalize to 100 → The line values are not the true % anymore.
Everything is re-expressed as a fraction of the recent maximum, so 100 = “highest in the lookback window,” not “100% of shares.”
If the true max was 30% of shares traded, and today is 15%, then the plot will show 50 (because 15 is half of 30).
开源脚本
秉承TradingView的精神,该脚本的作者将其开源,以便交易者可以查看和验证其功能。向作者致敬!您可以免费使用该脚本,但请记住,重新发布代码须遵守我们的网站规则。
免责声明
这些信息和出版物并非旨在提供,也不构成TradingView提供或认可的任何形式的财务、投资、交易或其他类型的建议或推荐。请阅读使用条款了解更多信息。
开源脚本
秉承TradingView的精神,该脚本的作者将其开源,以便交易者可以查看和验证其功能。向作者致敬!您可以免费使用该脚本,但请记住,重新发布代码须遵守我们的网站规则。
免责声明
这些信息和出版物并非旨在提供,也不构成TradingView提供或认可的任何形式的财务、投资、交易或其他类型的建议或推荐。请阅读使用条款了解更多信息。