OPEN-SOURCE SCRIPT
已更新 Gann Seasonal Dates by JayC
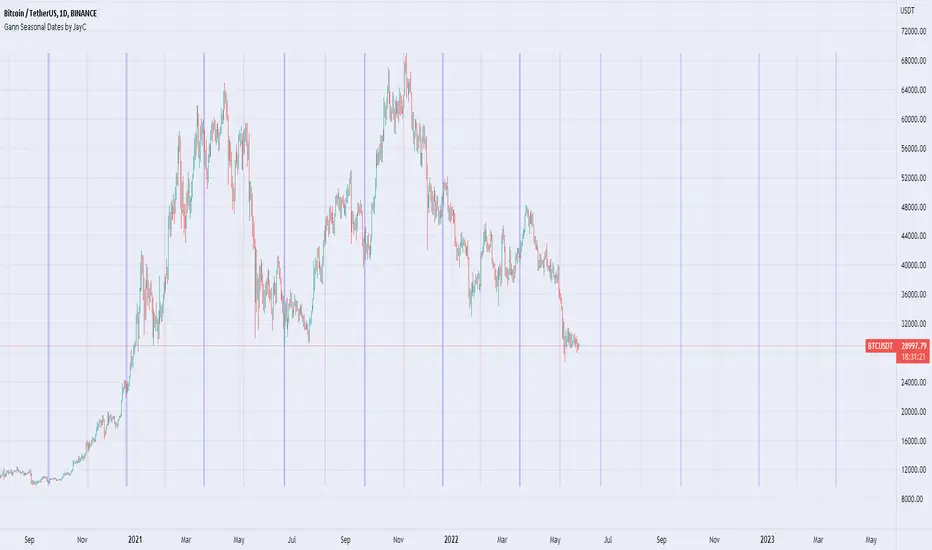
This script marks important seasonal dates with a vertical line that Gann used to watch for Trend changes.
March 21st
June 22nd
September 23rd
December 22nd
And 50% Levels - Minor seasonal dates.
February 4th
May 6th
August 8th
November 7th
In the settings you can change line colors and toggle the Offset. Offset is the way the script draws lines to show future dates, I offset by 365 so it will show incorrectly at some points in back testing.
版本注释
Added fix to only offSet future dates. Still not sure why some charts glitch开源脚本
秉承TradingView的精神,该脚本的作者将其开源,以便交易者可以查看和验证其功能。向作者致敬!您可以免费使用该脚本,但请记住,重新发布代码须遵守我们的网站规则。
免责声明
这些信息和出版物并非旨在提供,也不构成TradingView提供或认可的任何形式的财务、投资、交易或其他类型的建议或推荐。请阅读使用条款了解更多信息。
免责声明
这些信息和出版物并非旨在提供,也不构成TradingView提供或认可的任何形式的财务、投资、交易或其他类型的建议或推荐。请阅读使用条款了解更多信息。