PROTECTED SOURCE SCRIPT
已更新 Mind the GAP! (Automatic Intraday GAP Overnight) | by Octopu$
🤏 Mind the GAP! (Automatic Intraday GAP Overnight) | by Octopu$
Gaps are areas on a chart where the price of a stock moves sharply up or down, with little or no trading in between.
When it happens overnight (not considering Extended Hours), it is just considered as Price Level, for possible revisit.
A Gap is defined when the Open current Candle is Higher or Lower than the Close of the Last Candle:
When the Open of the current Candle is Higher than the Close of the Last Candle it is considered a Gap UP;
When the Open of the current Candle is Lower than the Close of the Last Candle it is considered a Gap DOWN;
Something interesting about Gap is that:
1. The Price Action can travel fast between these levels (Volatility);
2. One (or both) of these levels (Hi/Lo) can act as Support (or Breakout);
3. One (or both) of these levels (Hi/Lo) can act as Resistance (or Breakout).
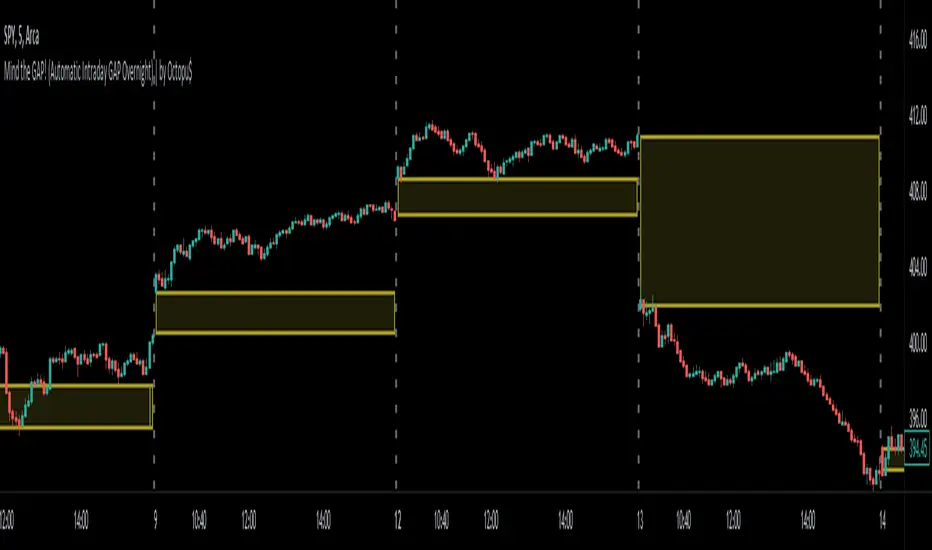
This Indicator includes these Gaps added Automatically to your Chart.
It is also built-in with a Shadow between the lines for easy visualization.
Colors are also customizable and the Lines are also editable according t your preferences.
Any Time Frame. Any Ticker.
(Using SPY 5m just as an example:)
tradingview.com/chart/Nk9RhGET/
 SPY
SPY
Features:
• Identifies Gaps on MC/MO
• Automatically adds Lines to these levels
• Includes shadow for easy visualization
Options:
• Customizable: Colors and Lines
• On/Off Switches for the Levels
• Show/Hide Previous Days
Notes:
v1.0
Indicator release
Changes and updates can come in the future for additional functionalities or per requests.
Did you like it? Boost it. Shoot a message! I'd appreciate if you dropped by to say thanks.
- Octopu$
🐙
Gaps are areas on a chart where the price of a stock moves sharply up or down, with little or no trading in between.
When it happens overnight (not considering Extended Hours), it is just considered as Price Level, for possible revisit.
A Gap is defined when the Open current Candle is Higher or Lower than the Close of the Last Candle:
When the Open of the current Candle is Higher than the Close of the Last Candle it is considered a Gap UP;
When the Open of the current Candle is Lower than the Close of the Last Candle it is considered a Gap DOWN;
Something interesting about Gap is that:
1. The Price Action can travel fast between these levels (Volatility);
2. One (or both) of these levels (Hi/Lo) can act as Support (or Breakout);
3. One (or both) of these levels (Hi/Lo) can act as Resistance (or Breakout).
This Indicator includes these Gaps added Automatically to your Chart.
It is also built-in with a Shadow between the lines for easy visualization.
Colors are also customizable and the Lines are also editable according t your preferences.
Any Time Frame. Any Ticker.
(Using SPY 5m just as an example:)
tradingview.com/chart/Nk9RhGET/
Features:
• Identifies Gaps on MC/MO
• Automatically adds Lines to these levels
• Includes shadow for easy visualization
Options:
• Customizable: Colors and Lines
• On/Off Switches for the Levels
• Show/Hide Previous Days
Notes:
v1.0
Indicator release
Changes and updates can come in the future for additional functionalities or per requests.
Did you like it? Boost it. Shoot a message! I'd appreciate if you dropped by to say thanks.
- Octopu$
🐙
版本注释
Updates版本注释
First update+Positioning
Clean code
版本注释
v5 Update版本注释
Coloring受保护脚本
此脚本以闭源形式发布。 但是,您可以自由使用,没有任何限制 — 了解更多信息这里。
🐙 Join me: bit.ly/JoinOctopuS
💰 Donate: bit.ly/ThankYouOctopuS
🐦 Twitter: twitter.com/OctopuSSSign
💰 Donate: bit.ly/ThankYouOctopuS
🐦 Twitter: twitter.com/OctopuSSSign
免责声明
这些信息和出版物并非旨在提供,也不构成TradingView提供或认可的任何形式的财务、投资、交易或其他类型的建议或推荐。请阅读使用条款了解更多信息。
受保护脚本
此脚本以闭源形式发布。 但是,您可以自由使用,没有任何限制 — 了解更多信息这里。
🐙 Join me: bit.ly/JoinOctopuS
💰 Donate: bit.ly/ThankYouOctopuS
🐦 Twitter: twitter.com/OctopuSSSign
💰 Donate: bit.ly/ThankYouOctopuS
🐦 Twitter: twitter.com/OctopuSSSign
免责声明
这些信息和出版物并非旨在提供,也不构成TradingView提供或认可的任何形式的财务、投资、交易或其他类型的建议或推荐。请阅读使用条款了解更多信息。