PROTECTED SOURCE SCRIPT
已更新 Probability Bands [Anan]
Hello Friends,,,
===================================
This indicator is based on Bayes' Theorem and is fully based on probabilities.
===================================
Formula For Bayes' Theorem:
P(Bull|Bear) = P(Bear∣Bull) * P(Bull) / P(Bear)
where:
Bull and Bear are events and P is probability
P(Bull|Bear) is the posterior probability, the probability of Bull after taking into account Bear
P(Bear∣Bull) is the conditional probability or likelihood, the degree of belief in Bear given that proposition of Bull belief (Bull true)
P(Bull) is the prior probability, the probability of Bull belief
P(Bear) is the prior probability, the probability of Bear belief
===================================
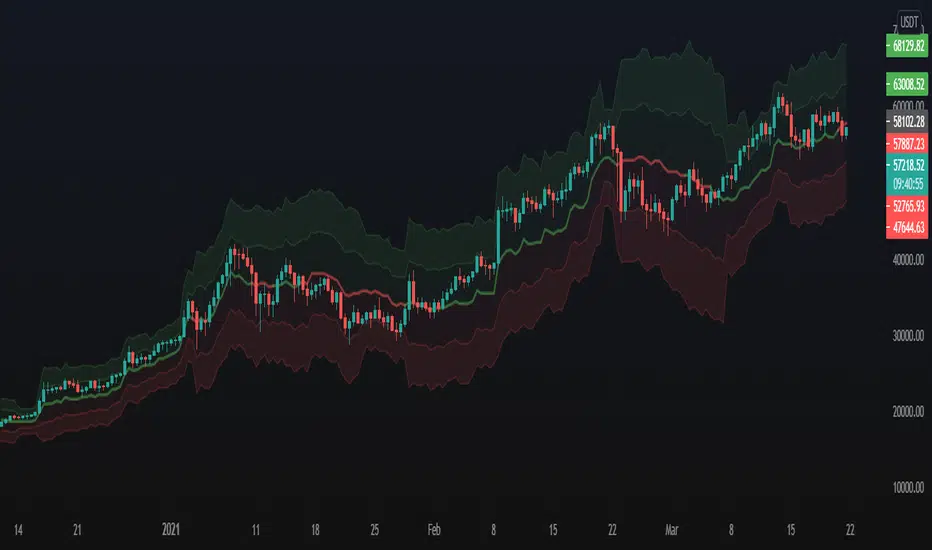
The indicator output one trend lines and (Bull/Bear) Signal :
Bull/Bear Probability Trend :
when the price is above mid line ==> Up Trend
when the price is below mid line ==> Down Trend
And by using ATR deviation multipliers, we can get (Bullish/Bearish) zones

===================================
Disclaimer:
This script is for informational and educational purposes only.
Use of the script does not constitutes professional and/or financial advice.
You alone the sole responsibility of evaluating the script output and risks associated with the use of the script.
===================================
===================================
This indicator is based on Bayes' Theorem and is fully based on probabilities.
===================================
Formula For Bayes' Theorem:
P(Bull|Bear) = P(Bear∣Bull) * P(Bull) / P(Bear)
where:
Bull and Bear are events and P is probability
P(Bull|Bear) is the posterior probability, the probability of Bull after taking into account Bear
P(Bear∣Bull) is the conditional probability or likelihood, the degree of belief in Bear given that proposition of Bull belief (Bull true)
P(Bull) is the prior probability, the probability of Bull belief
P(Bear) is the prior probability, the probability of Bear belief
===================================
The indicator output one trend lines and (Bull/Bear) Signal :
Bull/Bear Probability Trend :
when the price is above mid line ==> Up Trend
when the price is below mid line ==> Down Trend
And by using ATR deviation multipliers, we can get (Bullish/Bearish) zones
===================================
Disclaimer:
This script is for informational and educational purposes only.
Use of the script does not constitutes professional and/or financial advice.
You alone the sole responsibility of evaluating the script output and risks associated with the use of the script.
===================================
版本注释
fix color.版本注释
fix版本注释
Fix受保护脚本
此脚本以闭源形式发布。 但是,您可以自由使用,没有任何限制 — 了解更多信息这里。
免责声明
这些信息和出版物并非旨在提供,也不构成TradingView提供或认可的任何形式的财务、投资、交易或其他类型的建议或推荐。请阅读使用条款了解更多信息。
受保护脚本
此脚本以闭源形式发布。 但是,您可以自由使用,没有任何限制 — 了解更多信息这里。
免责声明
这些信息和出版物并非旨在提供,也不构成TradingView提供或认可的任何形式的财务、投资、交易或其他类型的建议或推荐。请阅读使用条款了解更多信息。