OPEN-SOURCE SCRIPT
10% Drop from Current High - Akshay
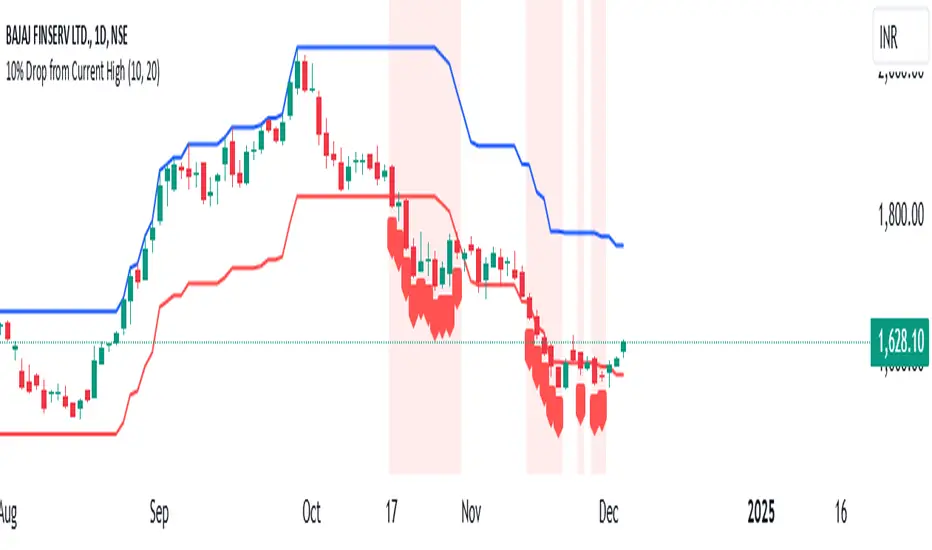
10% Drop from Current High TradingView Indicator
Description:
The "10% Drop from Current High" indicator dynamically tracks the highest price within a user-defined period and highlights when the current price drops by a specified percentage. This tool is invaluable for traders looking to monitor significant pullbacks or corrections from recent highs.
Key Features:
Customizable Drop Percentage:
Allows users to set the percentage drop to track, with a default value of 10%.
Configurable via an input field to suit different trading strategies and market conditions.
Lookback Period:
Tracks the highest price over a user-defined lookback period (default is 20 bars).
This ensures the indicator adapts to short-term or long-term market conditions based on user preferences.
Dynamic Levels:
Current High Level: Plots the highest price within the lookback period in blue.
Drop Level: Plots the calculated drop level (e.g., 10% below the current high) in red.
Visual Alerts:
Background Highlighting:
A translucent red background appears when the current price is at or below the drop level, signaling a significant pullback.
Shape Marker:
A downward label is plotted below the bar when the price touches or falls below the drop level, providing cSet Alerts:lear visual feedback.
Overlay on Price Chart:
The indicator is plotted directly on the price chart (overlay=true), ensuring seamless integration with other technical analysis tools.
Use Case:
This indicator is designed for traders who want to:
Monitor Pullbacks:
Identify when the price of an asset experiences a defined percentage drop from its recent high, signaling potential reversal zones or buying opportunities.
Use visual cues to react quickly to price movements.
Analyze Trends:
Combine with other indicators to assess the strength of trends and corrections.
Customization Options:
Drop Percentage: Adjust the percentage drop to track based on asset volatility and trading strategy.
Lookback Period: Modify the lookback period to focus on short-term (e.g., 5 bars) or long-term (e.g., 50 bars) price highs.
This indicator provides a flexible and intuitive way to track price pullbacks, helping traders make informed decisions and stay ahead in dynamic market conditions.
开源脚本
秉承TradingView的精神,该脚本的作者将其开源,以便交易者可以查看和验证其功能。向作者致敬!您可以免费使用该脚本,但请记住,重新发布代码须遵守我们的网站规则。
免责声明
这些信息和出版物并非旨在提供,也不构成TradingView提供或认可的任何形式的财务、投资、交易或其他类型的建议或推荐。请阅读使用条款了解更多信息。
开源脚本
秉承TradingView的精神,该脚本的作者将其开源,以便交易者可以查看和验证其功能。向作者致敬!您可以免费使用该脚本,但请记住,重新发布代码须遵守我们的网站规则。
免责声明
这些信息和出版物并非旨在提供,也不构成TradingView提供或认可的任何形式的财务、投资、交易或其他类型的建议或推荐。请阅读使用条款了解更多信息。