INVITE-ONLY SCRIPT
STS_RSI_MTF
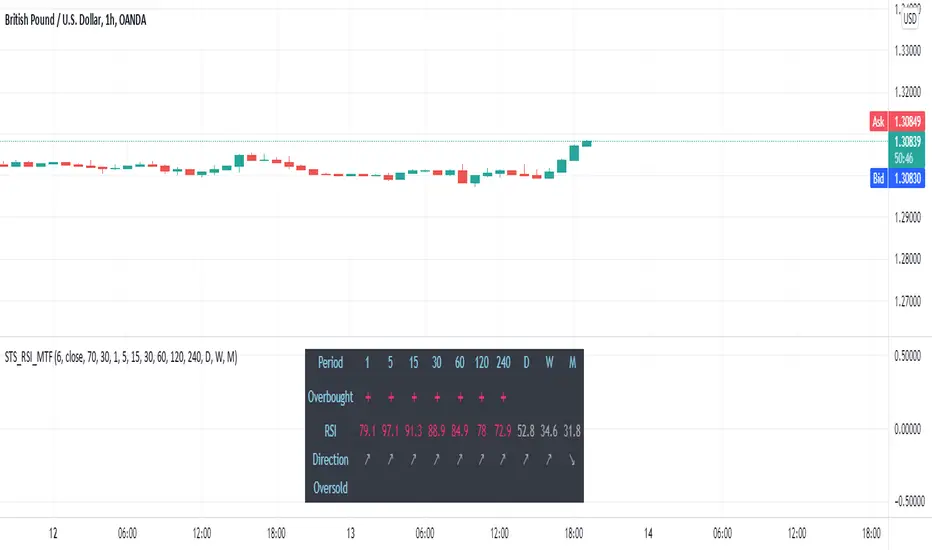
The STS RSI MTF Indicator shows overbought and oversold conditions of the RSI. It follows and displays the RSI values on all timeframes from M1 to MN1 in the lower left corner of your chart.
The RSI options are completely adjustable. You can choose different periods for the RSI. Multiple variants for the RSI applied price can be chosen (e.g. close price, open price, high, low, etc.). Different values can be set for the Up and Down levels of the RSI.
For example, if you set the STS RSI MTF indicator with Up level 70 and Down level 30, it will show in green all values below 30 (oversold), and in red all values above 70 (overbought).
仅限邀请脚本
只有作者授权的用户才能访问此脚本。您需要申请并获得使用许可。通常情况下,付款后即可获得许可。更多详情,请按照下方作者的说明操作,或直接联系SmartTradingSoftware。
TradingView不建议您付费购买或使用任何脚本,除非您完全信任其作者并了解其工作原理。您也可以在我们的社区脚本找到免费的开源替代方案。
作者的说明
Visit us at https://smarttradingsoftware.com
Contact us at office@smarttradingsoftware.com
免责声明
这些信息和出版物并非旨在提供,也不构成TradingView提供或认可的任何形式的财务、投资、交易或其他类型的建议或推荐。请阅读使用条款了解更多信息。